Typst
Misc
Alternative to LaTeX for formatting pdfs.
Also see Job, Reports >> Layouts
Packages
- {r2typ} - An R package for generating Typst markup
- {tyndling} - Provides bindings to the ‘Typst’ typesetting system, enabling users to compile ‘Typst’ documents directly from R.
- The package interfaces with the ‘Typst’ ‘Rust’ library to render documents, making it possible to integrate ‘Typst’-based workflows into R scripts, reports, and reproducible research pipelines.
- Supports programmatic document generation, compilation, and output handling, facilitating seamless use of ‘Typst’ alongside tools such as knitr and Quarto
- Similar to {typr} which compiles your document using the Typst/Quarto CLI, while {tynding} uses the Typst compiler itself via the Typst Rust library.
- Portable in the sense that you don’t have to worry about installing Typst separately and/or adding it to your PATH.
- {typstable} - Produce publication-ready tables for Quarto documents targeting the Typst format
Documentation
- Docs
- Reference
- Quarto Options
- Typst CSS, Other Typst CSS Docs
Resources
Notes from
Comparison with LaTeX
LaTeX
\usepackage{geometry} \usepackage{eso-pic} \usepackage{xcolor} \geometry{a4paper, total={170mm,257mm}, left=20mm, top=20mm, bottom=20mm, right=50mm} \definecolor{light}{HTML}{E6E6FA} \AddToShipoutPicture{% \AtPageLowerLeft{% \put(\LenToUnit{\dimexpr\paperwidth-3cm},0){% \color{light}\rule{3cm}{\LenToUnit\paperheight}}% }% }%- Advantages
- You want to include equations (currently easier in LaTeX)
- (Currently) more flexibility with images and tables
- Advantages
Typst
set page( margin: (left: 2cm, right: 1.5cm, top: 2cm, bottom: 2cm), background: place(right + top, rect( fill: rgb("#E6E6FA"), height: 100%, width: 3cm, )) )- Advantages
- Easier to learn
- More informative error messages
- No extra installations
- Speed
- Advantages
Font
---
title: "My document"
format:
  typst:
    mainfont: "Cascadia Code"
---
Including {gt} tables (source)
#outline(
  title: "List of Tables",
  target: figure.where(kind: "quarto-float-tbl")
)

`#show figure: set block(breakable: true)`{=typst}
Components
- Bindings
let(docs)- Used to define variables (valid variable names)
- Used to create a custom named function
- Used to destructure arrays and dictionaries.
- Context (docs) -
context- Keyword that precedes an expression and ensures that it is computed with knowledge of its environment.- Gives us access to set rule values
Accessing a field
set text(lang: "de")
// output: de
context text.lang
Context expression stored as a variable
let value = context text.lang
// output: en (default)
value

set text(lang: "de")
// output: de
value
- Locates where in the document you currently are, relative to other elements, and absolutely on the pages
Retrieve the value of the heading counter (source)
set heading(numbering: "1.") = Introduction <intro> lorem(5) // output: (1,) context counter(heading).get() = Background <back> lorem(5) // output: (2,) context counter(heading).get() context [ // output: (2,) counter(heading).at(here()) \ // output: (1,) counter(heading).at(<intro>) ]- Results in headings, “1. Introduction” and “2. Background” — each with 5 ipsum lorem words underneath.
.at(here())produces the same result as.getbut is more flexible.- A location in the document can also be accessed through labels (e.g. intro)
- Functions (docs)
- Text
text(docs) - Customizes the look and layout of text in a variety of ways.- Use to set rules and directly. While the set rule is often the simpler choice, calling the text function directly can be useful when passing text as an argument to another function.
- Layout
align(docs) - Aligns content horizontally and verticallyblock(docs) - A block-level container- Can give a background to content while still allowing it to break across multiple pages
- Can force elements that would otherwise be inline to become block-level
- Can be used in header styling
box(docs) - An inline-level container that sizes content.- All elements except inline math, text, and boxes are block-level and cannot occur inside of a paragraph. The box function can be used to integrate such elements into a paragraph.
- Boxes take the size of their contents by default but can also be sized explicitly.
- Can be used in contructing value boxes
grid(docs) - Allows you to arrange content in a grid. You can define the number of rows and columns, as well as the size of the gutters between them. There are multiple sizing modes for columns and rows that can be used to create complex layouts.place(docs) - Places content relatively to its parent containerv(docs) - Vertical spacing
- Definitions (docs) - These are used like methods in python. These are definitions that I think are available to most functions. Note that fields are also accessed in this manner (See Context).
.fields- Fields to filter for.where- Returns a selector that filters for elements belonging to this function whose fields have the values of the given arguments..with- Returns a new function that has the given arguments pre-applied.
- Foundations (docs) - Basic data types like integers and strings as well as details about core computational functions
datetime(docs) - A date, a time, or a combination of both..today- Current date.display- Displays the datetime in a specified format
- Introspection (docs) - For interactions between document parts. Often used with
contextcounter(docs) - Counts through pages, elements, figures, etc. Access and manipulate page, section, figure, and equation counters or create custom ones.- Definitions:
.at,.display,.final,.get,.step,.update
- Definitions:
- Visualize (docs) - Shapes, line, color gradients, etc.
line(docs)
- Text
- Rules
set(docs) - Allows you to customize the appearance of elements. They are written as a function call to an element function preceded by thesetkeyword (or#setin markup).show(docs) - Used to customize the look of a particular element- show-set: Written as the
showkeyword followed by a selector (e.g. element function), a colon and then a set rule. - Transformational: Allows you to provide an even more customized format for an element.
- Replace the set rule after the colon with an arbitrary function. This function receives the element in question and can return arbitrary content.
- The function is often defined inline as
it => ..using the unnamed function syntax. The function’s parameter is typically named “it” by convention.
- show-set: Written as the
Templates
Example 1: Basic
YAML
--- title: "My document" format: typst: template-partials: - typst-template.typ - typst-show.typ ---typst-show.typtakes the variables from the quarto document and passes them to typsttypst-template.typ- Once typst has the quarto variables, it creates this template which is used to create the pdf
Show
#show: article.with( $if(title)$ title: "$title$", $endif$ ) # another example with a param town in quarto yaml #show: psc-report.with( $if(title)$ title: "$title$", $endif$ $if(params.town)$ town: "$params.town$", $endif$ )- Says if there’s a title in the qmd, then create a variable, title, with its value
Template
#let article(
  // The document title.
  title: "Some title",
  // The document content.
  body
) = {

  // Set document metadata.
  set document(title: title)

  // Links should be purple.
  show link: set text(rgb("#800080"))

  // Title.
  text(weight: 800, upper(title))
}
Example 2: Header and Footer Styling (source)
Also see this Rennie post on adding a color bar with shape to the side of the page
Show
#show: psc-report.with( $if(title)$ title: "$title$", $endif$ $if(params.town)$ town: "$params.town$", $endif$ )- Sets variables for title metadata and town param from quarto YAML
Template
Code
#let psc-report( title: "title", town: "town", body, ) = { // text style for whole report set text( font: "Open Sans", size: 12pt, ) set page( // dimensions of document paper: "us-letter", // or "a4" margin: (left: 1in, right: 1in, top: 0.7in, bottom: 1in), // places blue rectangle in header background: place(top, rect(fill: rgb("15397F"), // hex-code for color width: 100%, height: 0.5in ) ), // creates layout for text in header rectangle header: align( horizon, grid( columns: (80%, 20%), // div sizes for title, town text // title text properties align(left, text(size: 20pt, fill: white, weight: "bold", title)), // town text properties align(right, text(size: 12pt, fill: white, weight: "bold", town) ) ) ), // page number, image footer: align( grid( columns: (40%, 60%), // page number, graphic align(horizon, text(fill: rgb("15397F"), size: 12pt, counter(page).display("1"))), // sets page number align(right, image("assets/psclogo.svg", height: 300%) ) ) ) body }- The function ,
psc-report, arguments set the variable values (from the show file) for title and town- Variables seen in the header section
- Sections:
set text,set page, body - Functions: text, page, place, grid, align
- The function ,
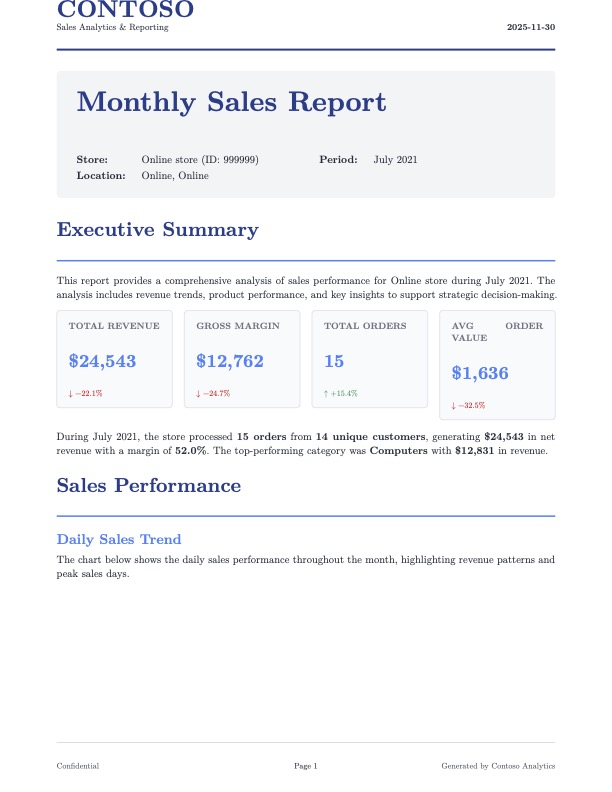
Example 3: Sales Report (source, github, R >> Code >> Reports >> burst-reporting)
1 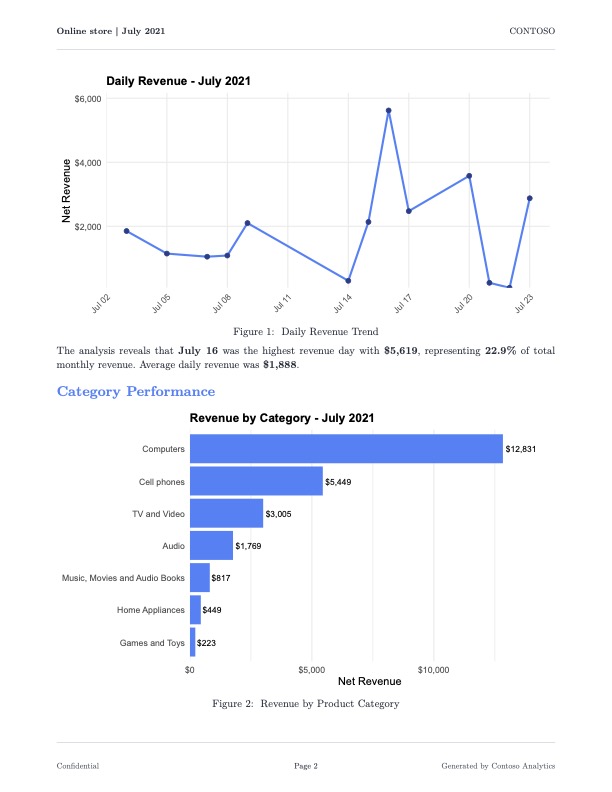
2 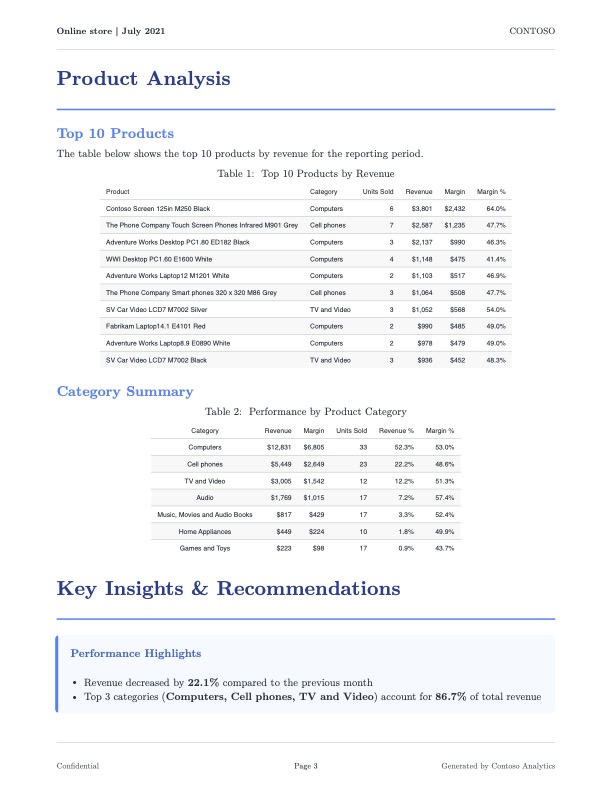
3 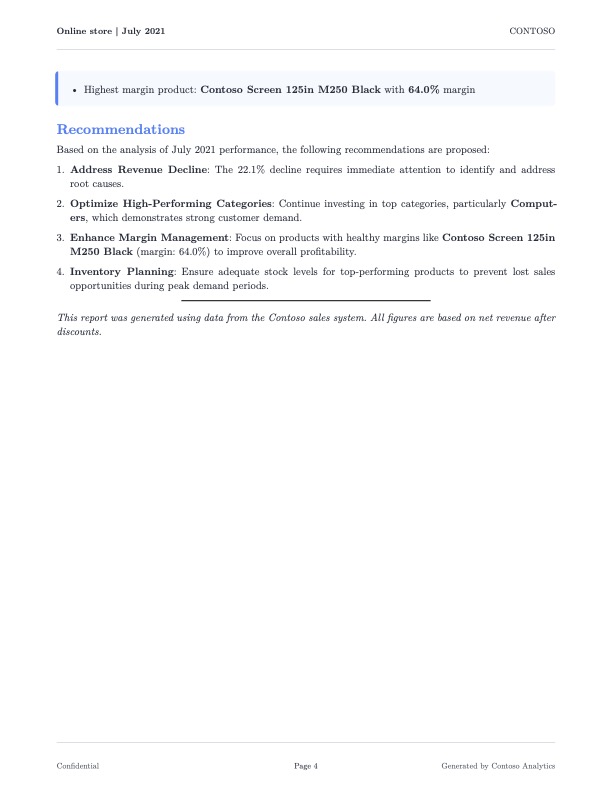
4 The complete code is in the github and directory
Template
Header
Code
#let sales-report( title: "Monthly Sales Report", store-name: "Store Name", store-id: "000", report-period: "Month YYYY", report-date: datetime.today().display(), country: "", state: "", body ) = { // Color palette as variables for consistency let primary-color = rgb("#1e3a8a") let secondary-color = rgb("#3b82f6") // ... additional colors ... set page( paper: "us-letter", margin: (top: 2.5cm, bottom: 2.5cm, left: 2cm, right: 2cm), header: context { // First page gets branded header; subsequent pages get minimal header if counter(page).get().first() == 1 { // ... logo, company name, date ... } else { // ... store name, period, page number ... } } ) // Heading styles using show rules show heading.where(level: 1): it => block( width: 100%, above: 24pt, below: 16pt, { text(size: 20pt, weight: "bold", fill: primary-color, it.body) v(6pt) line(length: 100%, stroke: 1.5pt + secondary-color) } ) body }- SCSS color variables are set with the
letkeyword sales-reportsectionsset pagesection applies the custom header to the first page usingcontextandcountershow headingstyles the H1 (level: 1) headers
- Functions:
page,counter,block,text,v,line
- SCSS color variables are set with the
KPI Boxes
Code
#let kpi-box(title, value, change: none, color: rgb("#3b82f6")) = { box( width: 100%, fill: rgb("#f9fafb"), inset: 12pt, radius: 4pt, stroke: 1pt + rgb("#e5e7eb"), { text(size: 9pt, weight: "semibold", fill: rgb("#6b7280"), upper(title)) v(4pt) text(size: 18pt, weight: "bold", fill: color, value) if change != none { v(2pt) text( size: 8pt, fill: if change > 0 { rgb("#059669") } else { rgb("#dc2626") }, weight: "medium", if change > 0 { [↑ +#change%] } else { [↓ #change%] } ) } } ) }- Shows the percent change since the last reporting period, and colors it differently based on whether the change is positive or negative.
- It’s essentially a value box that contains 3 text lines which are separated by the (2) vertical spaces (
v) - In
{ [↑ +#change%] }, the up arrow and percent sign are shown asis in the rendered box, and#changecalls the argument value for change - Functions:
box,text,v
Info-Boxes
Code
#let info-box(title, body, color: rgb("#3b82f6")) = { block( width: 100%, fill: color.lighten(95%), inset: 14pt, radius: 4pt, stroke: (left: 3pt + color), below: 12pt, { if title != none { text( size: 11pt, weight: "bold", fill: color.darken(20%), title ) v(8pt) } body } ) }- These are essentially callout blocks in quarto which makes me wonder if the quarto callout block can’t just be used instead.
- See Quarto, Documents >> Layouts >> Callout Blocks
Quarto Document
Code
--- format: typst: keep-typ: false params: store_key: 999999 year: 2024 month: 2 --- ```{=typst} #import "sales-report-template.typ": * ``` ```{r} #| label: setup #| include: false # packages # ggplot theme set # Set knitr options for graphics knitr::opts_chunk$set( dev = "svglite" ) ``` ```{r} #| label: data-prep #| include: false # data prep code ``` ```{=typst} #show: sales-report.with( title: "Monthly Sales Report", store-name: "`r store_info$description`", store-id: "`r store_id`", report-period: "`r report_period`", country: "`r store_info$country_name`", state: "`r if_else(is.na(store_info$state), '', store_info$state)`" ) ``` # Executive Summary This report provides a comprehensive analysis of sales performance for `r store_info$description` during `r report_period`. The analysis includes revenue trends, product performance, and key insights to support strategic decision-making. ```{=typst} #grid( columns: (1fr, 1fr, 1fr, 1fr), column-gutter: 12pt, kpi-box( "Total Revenue", "`r dollar(current_metrics$total_revenue, accuracy = 1)`", change: `r round(revenue_change, 1)` ), kpi-box( "Gross Margin", "`r dollar(current_metrics$total_margin, accuracy = 1)`", change: `r round(margin_change, 1)` ), kpi-box( "Total Orders", "`r comma(current_metrics$total_orders)`", change: `r round(orders_change, 1)` ), kpi-box( "Avg Order Value", "`r dollar(current_metrics$avg_order_value, accuracy = 1)`", change: `r round(aov_change, 1)` ) ) ``` etc, etc, etc ```{=typst} #info-box("Performance Highlights", [ - Revenue `r revenue_trend` by *`r abs(round(revenue_change, 1))`%* compared to the previous month - Top 3 categories (*`r paste(top_3_categories$category_name, collapse = ", ")`*) account for *`r percent(sum(top_3_categories$revenue_pct)/100, accuracy = 0.1)`* of total revenue - Highest margin product: *`r top_margin_product$product_name`* with *`r percent(top_margin_product$margin_pct/100, accuracy = 0.1)`* margin ]) ``` line break at the end of document ---- See the repo/code directory for the complete code
- The “show” code that would normally be in a
sales-report-show.typis in a typst chunk - Inline R code is allowed in the typst chunks
- Evidently there’s a different way of doing this through a quarto template, but he said this way (typst chunks I think) gave him more control over the layout
Generate Reports
Code
generate_report <- function( store_key, year, month, store_name ) { # Create unique temporary directory for this render to avoid conflicts temp_dir <- tempfile( pattern = sprintf("quarto_%06d_%04d%02d_", store_key, year, month) ) dir.create(temp_dir, recursive = TRUE) tryCatch( { # Format output filename output_file <- sprintf("store_%06d_%04d-%02d.pdf", store_key, year, month) output_path <- file.path(OUTPUT_DIR, output_file) # Copy Quarto template to temp directory file.copy("sales-report.qmd", file.path(temp_dir, "sales-report.qmd")) # Copy Typst template if it exists if (file.exists("sales-report-template.typ")) { file.copy( "sales-report-template.typ", file.path(temp_dir, "sales-report-template.typ") ) } withr::with_dir( temp_dir, { temp_output <- file.path(temp_dir, output_file) quarto_render( input = file.path(temp_dir, "sales-report.qmd"), output_file = output_file, output_format = "typst", execute_params = list( store_key = store_key, year = year, month = month ), quiet = TRUE ) } ) # Move rendered file to final location if (file.exists(temp_output)) { file.copy(temp_output, output_path, overwrite = TRUE) } # Clean up temp directory unlink(temp_dir, recursive = TRUE) # Get file size if (file.exists(output_path)) { file_size <- file.info(output_path)$size file_size_kb <- round(file_size / 1024, 1) #log_msg(sprintf("SUCCESS: %s (%s KB)", output_file, file_size_kb)) return(list( success = TRUE, store_key = store_key, year = year, month = month, output_file = output_file, file_size_kb = file_size_kb )) } else { # log_msg( # sprintf("ERROR: Output file not found: %s", output_file), # "ERROR" # ) return(list( success = FALSE, store_key = store_key, year = year, month = month )) } }, error = function(e) { # Clean up temp directory on error if (dir.exists(temp_dir)) { unlink(temp_dir, recursive = TRUE) } error_msg <- sprintf( "Failed for store %d (%d-%02d): %s", store_key, year, month, e$message ) #log_msg(error_msg, "ERROR") return(list( success = FALSE, store_key = store_key, year = year, month = month, error = e$message )) } ) } # Start mirai daemons daemons(NUM_WORKERS, dispatcher = TRUE) results <- mirai_map( select(store_months, store_key, year, month), \(store_key, year, month) { library(dplyr) library(lubridate) library(quarto) generate_report( store_key = store_key, year = year, month = month ) }, generate_report = generate_report, OUTPUT_DIR = OUTPUT_DIR )[.progress] # Stop mirai daemons daemons(0)- See repo/code directory for complete script which includes some of these variable values, a logging function, and console messaging
Extensions
- Installing the extension downloads a .typ file with some styling
- Usage
Example: dept-news extension
---
title: "Chemistry Department"
format:
  dept-news-typst: default
---