Design
Misc
- Packages
- {MOSAlloc} - Provides a framework for multipurpose optimal resource allocation in survey sampling
- Allows for the consideration of precision and cost constraints at the subpopulation level while minimizing either a vector of sampling errors or survey costs across a broad range of optimal sample allocation problems. The approach supports both single- and multistage designs.
- {MOSAlloc} - Provides a framework for multipurpose optimal resource allocation in survey sampling
- Resources
- Encyclopedia of Survey Research Methods, Lavrakas 2008 (See R >> Documents >> Surveys)
- Designing Survey Experiments (See R >> Documents >> Surveys)
- Papers/Articles
- Information Equivalence in Survey Experiments
- Designing Information Provision Experiments
- Why reversed items can be problematic in survey research
- Negatively worded items (also called reversed or reverse coded items) are items that are formulated in the opposite direction to the measured construct
- Establishing study objectives is the first step in designing a survey. Defining the universe should be the second step — then, the target population and sampling frame — finally, the sampling methodology.
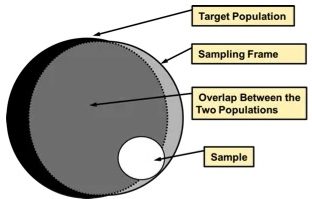
- Example: Relationships between Universe, Inferential Population, and Target Population
- The Universe (aka population of interest) is defined as the general population of the United States
- The Inferential Population for the survey is conceptualized to fulfill the research intent by refining the time scope to the year 2008
- The Target Population is operationalized as the noninstitutional civilian persons residing in the conterminous United States between March 1, 2008, and September 30, 2008, who speak English or Spanish.
- Example: Relationships between Universe, Inferential Population, and Target Population
- Basic checklist before sending out your survey (source)
- You know your target population
- You know how many respondants from your target population you need to overcome sources of error
- Pilot surveys have been conducted to confirm the responses being collected are of the form that can analyzed in order to answer your research question
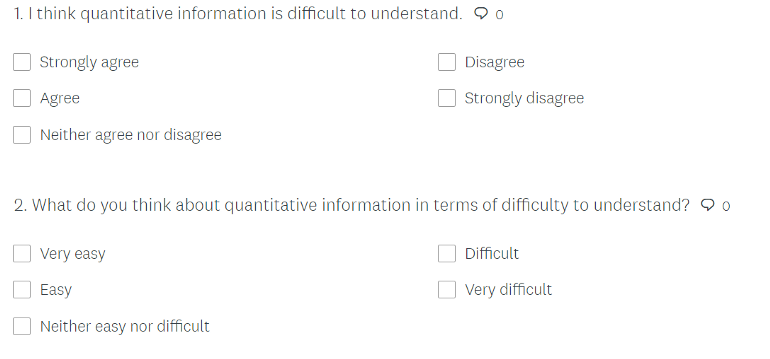
- Item-specific surveys perform better/more reliable than agree/disagree surveys. The reason behind this is that participants are more certain while choosing a position in item-specific surveys compared to agree/disagree surveys
- Complex Surveys (Lumley)
- The strata are a partition of the population into groups that we hope are different.
- Sample size is fixed for each stratum in advance, with the result that between-stratum differences in a variable don’t contribute to the sampling uncertainty for summaries of that variable. undefined
- Clusters are a partition of the population into groups that we fear are different, but which are convenient to sample.
- For cost reasons we can only sample a small fraction of the clusters, with the result that between-cluster differences in a variable often dominate the sampling uncertainty for summaries of that variable.
- The strata are a partition of the population into groups that we hope are different.
- For self-report surveys, ceiling/floor effects on score distributions disaappear when response options are greater than 2 or 3 (Thread, Paper)
- Survey Monkey sample size calculator
- If asking the Age or Income of a respondant:
- If calculating mean or median, exact numbers are best but respondants are usually hesitant to give out exact numbers for such data.
- Ranges give less accurate averages but respondants are more likely to answer.
- Group based on population your studying
- If it’s the general population, $20k or less is a good first rung; $21–39k is next; from there: $40–69k, $70–99k; $100–150k; and $150+
- If it’s college students, the ranges will be lower.
- Breaks between groups should line-up with known charcteristics of the population you’re studying
- If it’s the general population, $20k or less is a good first rung; $21–39k is next; from there: $40–69k, $70–99k; $100–150k; and $150+
- Use the phrases, jargon, and emotions that your customers are familiar with.
- Get a sense of this by getting on the phone and talking to your customers. Or run focus groups. Or run some on-site surveys.
- Best practices for the format of common demographic questions, link
Terms
- Complex Sample Surveys - Involve the identification and data collection of a sample of population elements via multiple stages or phases of identification and selection, e.g. stratification, clustering, multi-stage or multi-phase designs, unequal probability sampling, or multiple frame sampling.
- In contrast, a simple sample survey design involves a simple random sample, where there is a list of the elements of the population and a certain number of these elements is selected by drawing one at a time.
- Often reduces the cost of data collection and may be more efficient, but they also require special methods of variance estimation and in many cases yield larger variances than a simple random sample of the same size.
- Also see Surveys, Sampling Methods >> Probabilistic Sampling Methods >>
- Curbstoning - When a lazy survey interviewer doesn’t bother knocking on doors to talk to people and instead sits on the curbstone outside the house and makes up plausible responses
- Element - The basic unit that represents whatever is being sampled and from which survey data are to be gathered, e.g. adults, children, households, employees, businesses, students, schools, school districts, uniformed personnel, police districts.
- All the members within the target population are its elements.
- All the elements within a sampling frame from the target population that can be listed constitute the frame.
- All the elements that are selected for study from the sampling frame make up what is commonly called survey sample.
- All the selected elements from which data are gathered also are commonly referred to as the sample.
- Empirical Design - When the inclusion probabilities are unknown
- See Non-Probabilistic Sampling Methods
- Examples
- Quota Sampling - Units are selected so to reflect known structures for the population
- Expert Sampling - Units are selected according to expert advice
- Network Sampling - Existing sample units recruit future units from among their ‘network’.
- Frame - All the elements from the target population that can be listed constitute the frame. This will give each element a non-zero probability of selection for inclusion in the survey sample. (See Sampling Frame)
- e.g. A housing unit frame would be all citizens that can be feasibly listed as living in a housing unit
- A well-defined appropriate frame is essential to the sampling process, the development of weights for use in analyses of survey data, the minimization of coverage error, and the understanding of what coverage error may exist.
- Inferential Population - The population (or universe) to which the results from a sample survey are meant to generalize. Term is used more often during the conceptualization stage of research studies and surveys. Has the same components as a target population is more loosely defined.
- Multiple Frame Sampling (or Multi-Frame Sampling) - Surveys in which two or more frames are used and independent samples are respectively taken from each of the frames. Inferences about the target population are based on the combined sample data. Referred to as Dual-Frame Sampling when the survey uses two frames.
- Probabilistic Design - When every element in the population has a fixed, known-in-advance inclusion probabilities
- Sampling Bias - The probability distribution in the collected dataset deviates from its true natural distribution one would actually observe in the wilderness.
- Sampling Frame - A frame that represents the population of interest. An exhaustive list of all the individuals which comprise the target population. The frame that’s used to draw the sample. (Also see Sources of Error >> Coverage or Frame Error)
- Some studies employ multiple frames, either because they use multiple modes of data collection, because no single frame has adequate coverage, or to facilitate oversampling of certain groups.
- Questions when selecting a sampling frame:
- Does it include members of the universe being studied?
- Is it appropriate for the way the data will be collected?
- What is the quality of the frame in terms of coverage, completeness, and accuracy?
- Steps:
- Define your population of interest, such as all residents of a specific city, all customers of a particular business, or all members of an organization.
- Identify potential sources of information about your population, such as public records, membership lists, or customer databases.
- Evaluate the quality of each potential source. Consider factors like completeness, accuracy, and currency, and choose the sources that are most likely to give you an accurate and complete sampling frame.
- Combine your chosen sources to create a final sampling frame. This process might involve merging multiple databases and removing duplicates.
- Examples: area frames for in-person interviews, random-digit dialing (RDD) frames for telephone survey samples
- Self-Report Study - Type of survey, questionnaire, or poll in which respondents read the question and select a response by themselves without any outside interference. A self-report is any method which involves asking a participant about their feelings, attitudes, beliefs and so on.
- Survey Population - The subset of the target population that has a chance of survey inclusion because of their membership in, or linkage to, the sampling frame.
- Example: Traditional telephone surveys have a survey population of households with landline telephone service but typically are used to make inferences to target populations of all households, regardless of telephone service.
- Target Population - Often similar to the inferential population but excludes some elements that would be very difficult or costly to include on the frame.
- Components
- Elements (e.g., general population, students)
- Units to which the elements belong (e.g., household, school classroom)
- Geographic Boundaries (e.g., country, state)
- Time Periods (e.g., month, year)
- Elements in the inferential population but missing from the target population should be easy to describe and note in the survey documentation.
- Business surveys must specify the level of the business that comprises the units of the target population
- Business Finance Surveys typically define their target populations in terms of the enterprise — the organizational level that has ownership and makes decisions for the entire business.
- Labor Force Surveys define their target populations in terms of the establishment, that is, at the organizational level, where employment activities are conducted at or from a particular geographic location.
- Example: Multiple Target Populations
- A health care practices survey might have a target population defined in terms of households, another defined in terms of adults, and another defined in terms of children. Such a survey might sample households, collect household-level data, and then sample an adult and a child for interviews at those levels.
- Components
- Universe - Consists of all survey elements that qualify for inclusion in the research study. Once defined, the universe is used by the researcher to structure an appropriate sampling methodology, in particular by defining the target population and choosing a sampling frame or frames.
- Can be called Target Population of Population of Interest
- Example: Estimating the size of the universe
- if the researcher randomly contacts 1,000 households and finds that 45 of these own both a dog and a cat, the researcher can then estimate that roughly between 3% and 6% of all households in Australia own both types of pets.
Sources of Error
- Misc
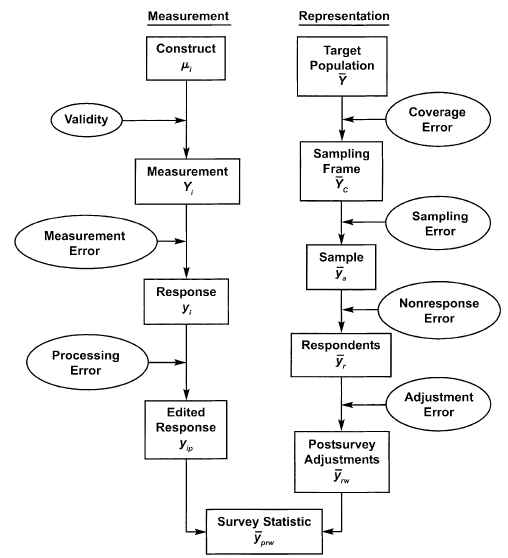
- Notes from Total Survey Error: Design, Implementation, and Evaluation (d/l pdf to see figures)
- Survey Error is defined as the deviation of a survey response from its underlying true value
- Survey Accuracy is defined as the deviation of a survey estimate from its underlying true parameter value
- Total Survey Error - Accumulation of all errors that may arise in the design, collection, processing, and analysis of survey data. It includes sampling variability, interviewer effects, frame errors, response bias, and non-response bias
- Non-Sampling Error
- Specification Error occurs when the concept implied by the survey question differs from the concept meant to be measured in the survey.
- Often caused by poor communication between the researcher, data analyst, or survey sponsor and the questionnaire designer.
- Coverage or Frame Error typically results from the frame construction process. Discrepancies between the (theoretical) target population of a survey and the frame which is used to draw a sample are equivalent to statistical errors.
- See Surveys, Sampling Methods >> Terms >> Sampling Frame
- In practice, frames are not error-free:
- They can never encompass the whole target population (because it always takes time to administrativally record an individual in a register),
- They also contain individuals which are no longer eligible (e.g. individuals who left the country and may keep recorded in the Register several months after they left).
- Coverage Errors or Frame Errors.
- Types
- Undercoverage - Some members of the universe are neither on the frame nor represented on it and hence have no chance of inclusion in the survey.
- Can lead to bias in estimates made from survey data
- Overcoverage - Some elements on the frame are not members of the universe.
- Along with bias in estimates, cost is even moreso the problem with overcoverage, because ineligibles must be identified and screened out. If the ineligibles can be identified before selecting the sample, it is usually better to eliminate them at that time.
- Undercoverage - Some members of the universe are neither on the frame nor represented on it and hence have no chance of inclusion in the survey.
- Undercoverage Examples
- All RDD landline frames exclude households with no telephone service, and those with only cellular phone service.
- Frames drawn from telephone directories exclude those households (listed in #1 above) plus those with unpublished and recently published numbers.
- New construction may be excluded from lists of addresses used as sampling frames for surveys conducted by mail or personal visit.
- Commercial lists of business establishments exclude many new businesses and may underrepresent small ones.
- Panels recruited for Internet research, even if the panels were recruited from a survey that used a probability sample with a good frame, may have self-selection bias. (See Experiments, A/B Testing >> Potential Biases >> Treatment Self Selection)
- Overcoverage Examples
- Some units may be duplicated an unknown number of times
- Some ineligible units may be included on the frame, such as businesses that are not farms in a farm survey.
- A sample of students enrolled in a school is selected. One might use a list provided by the school or the district; however, the list might include (overcoverage) students who had dropped out or transferred and omit students (undercoverage) who had enrolled after the list was compiled.
- Nonresponse Error - When the reason for nonresponse is related to the missing value, parameter estimates can be biased when nonresponse is not accounted for. Includes:
- Unit Nonresponse - Sampling unit does not respond to any part of the questionnaire
- e.g. Calling a person and them choosing not to answer or participate in the the survey
- Item Nonresponse - The questionnaire is partially completed.
- Unit Nonresponse - Sampling unit does not respond to any part of the questionnaire
- Measurement Error occurs when the method of obtaining the measurement affects the recorded value, often involving simultaneously the respondent, the interviewer, and the survey questionnaire.
- Processing Error refers to errors that arise during the data processing stage, including errors in the editing of the data, data encoding, the assignment of survey weights, and tabulation of the survey data.
- Specification Error occurs when the concept implied by the survey question differs from the concept meant to be measured in the survey.
- Sampling Error - Caused by collecting partial information over a fraction of the population rather than the whole population itself.
- Sampling scheme (e.g., Multistage or Multiple-Phase Sample)
- Sample size
- Choice of Estimator (e.g., a ratio or regression estimator, levels of post-stratification)
- Non-Sampling Error
- Keeping sampling errors under control
- Survey questionnaires must be prepared with utmost care, intensively pre-tested and field-tested in order to detect issues in question wording, routing problems or any other inconsistency
- Modes of data collection must be chosen and combined judiciously in order to get most people to cooperate
- Interviewers must be carefully recruited and properly trained
- Communication and contact strategies towards participants must be designed and adapted in order to reach highest participation.
Response Formats
- Item-Specific (IS) - Multiple Choice Response Format

- Agree/Disagree (A/D) - Response format where the response are degrees of strength of agreement or disagreement

Response Scales
Misc
- The default values and ranges you use
- Examples:
- Age: 5 yr default range (e.g. 20–25) instead of 10 yrs ranges
Types
Dichotomous Scales - Precise data, but they don’t allow for nuance in respondents’ answers.
- Examples: “Yes” or “No”; “True” or “False”; “Fair” or “Unfair”
Quantitative Scales
- Rating Scales
- Provides more range than Dichotmous scales. Too generic for attitudes
- 1–10; 1–7; 1–5 (or Likert scale, also see below)
- Label all number or none
- A 1–5 scale presented verbal descriptions for only the 1 and 5 endpoints and this led more people to choose the endpoints.
- A “school grade” scale is more reliable than other types of word labels
- Label all number or none
- Ordinal and Interval Scales
- With ordinal, the numbers just have an intrinsic order
- With interval, the distance between the numbers must also be equal in terms of context
- e.g. Rating something a 2 vs 1 doesn’t mean that being a 2 is “twice as good” as being a 1
- Unless being 5 is also twice as good as being a 4, etc.
- e.g. Rating something a 2 vs 1 doesn’t mean that being a 2 is “twice as good” as being a 1
- There is no practical difference between ordinal or interval scales
- Ratio Scales
- where there is a true zero and equal intervals between neighboring points. Unlike on an interval scale, a zero on a ratio scale means there is a total absence of the variable you are measuring. Length, area, and population are examples of ratio scales
- Rating Scales
Semantic Differential Scales
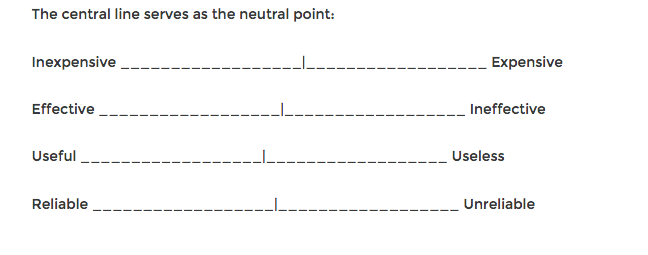
- Gather data and “interpret based on the connotative meaning of the respondent’s answer.”
- Usually have dichotomous words at either end of the spectrum
- The more quantifiable the information is (behavior questions, for instance), the smaller the range should be.
- When you want to measure attitudes or feelings, using a 5- or 7-point semantic differential scale is a good strategy.
Likert Scale
- Notes from:
- Quantitative, Rating scale
- Avoid using agree/disagree wording (see biases section below)
- Ordinal Likert data (AKA Unipolar or Interval ) - Involves category responses that have some natural order (decreasing/increasing) to them, the width of categories and the distance between categories are not necessarily consistent, and the categories often represent a underlying continuous scale that has been ‘binned’ (into the categories).
- Example: “How many glasses of water do you typically drink per day?” with response options:
Less than one glass/day
1-2 glasses/day
3-4 glasses/day
5-6 glasses/day
More than six glasses/day
- Example: “How many glasses of water do you typically drink per day?” with response options:
- Birectional Likert Data (AKA Bipolar) -Involves category responses that have a natural order with responses from two opposing directions — typically negative responses and positive responses — around a central (or neutral) point.
- Example: “The amount of reading I do influences how much reading my child does?”
- 5-point:
- [1] Strongly Disagree, [2] Disagree
- [3] (4pt removes this response) Neither Disagree Nor Agree
- [4] Agree, [5] Strongly Agree
- 7-point:
- [1] Strongly disagree, [2] Disagree, [3] Somewhat disagree
- [4] Neither agree nor disagree
- [5] Somewhat agree, [6] Agree, [7] Strongly agree
- 5-point:
- More examples, Link
- Example: “The amount of reading I do influences how much reading my child does?”
- Issues
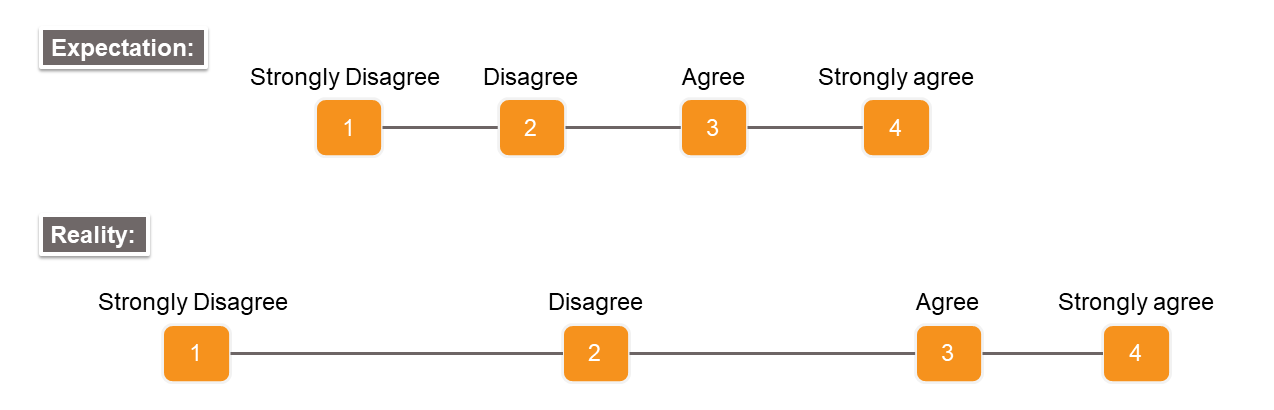
- Ordinal and not Interval
- Answers are not all equidistant
- Respondents may perceive (4) Strongly Agree and (3) Agree very similarly and thus the difference between these two options might be much smaller than the difference between (3) Agree and (2) Disagree, despite having the same distance.
- Respondents may perceive (4) Strongly Agree and (3) Agree very similarly and thus the difference between these two options might be much smaller than the difference between (3) Agree and (2) Disagree, despite having the same distance.
- Numerical values assigned to the response options cannot be treated as interval data
- Parametric statistics (e.g., mean, standard deviation) and parametric statistical methods (e.g., summing up individual questions to find a total survey score, running a regression with survey scores) would NOT yield valid results
- Acceptable Analysis Methods:
- Median and Mode
- Ordinal regression
- Chi-Square Test of Independence
- Item Response Theory (IRT) modeling
- Graphical Tools (e.g. bar charts and correlation matrix plots)
- Answers are not all equidistant
- Adding a neutral option (i.e. Neither Disagree Nor Agree)
- May increase the accuracy of survey data because respondents who do not have a strong preference may prefer to select the neutral response option, instead of randomly selecting a response option or skipping the question
- May produce a bias: research shows that respondents often see the visual midpoint of a scale as representing the middle response option
- Solutions:
- use a Likert scale that consists of an even number of response options without a neutral option
- select survey questions for which respondents would not select the neutral option very easily.
- Choosing the number of responses
- Research shows that Likert scales with 2 to 5 response options often yield precise results, although smaller numbers of response options may reduce the measurement precision of a survey
- Researchers found that there are no clear advantages of using beyond 6 response options on a Likert scale
- Positively and negatively worded questions together
- Typically used to prevent response bias
- Positively and negatively worded questions are not necessarily mirror images of each other.
- Therefore, when analyzing survey data, reverse-coding the Likert scale for negatively worded questions (e.g., 1-Strongly agree; 2-Agree; 3-Disagree; 4-Strongly disagree) may not necessarily put these questions in the same direction as positively worded questions
- Research shows that negative wording may confuse respondents, leading to less accurate responses to the survey questions
- May be increasing response bias instead of reducing it.
- Studies indicate that respondents are more likely to disagree with negatively worded questions than to agree with positive ones
- Example
- A respondent who would select Agree for “My room was clean” might prefer to select Strongly Disagree for “My room was dirty”.
- Example
- Solutions:
- Keep the number of negatively worded questions minimal, while taking the impact of negatively worded questions on responses into account.
- Sliding Scales
- Ordinal and not Interval
Guttman Scale
.png)
- Dichotomous or Likert
- Gradually increases in specificity. The intent of the scale is that the person will agree with all statements up to a point and then will stop agreeing.
- The scale may be used to determine how extreme a view is, with successive statements showing increasingly extremist positions.
- Also, a useful tool for measuring satisfaction
- If needed, the escalation can be concealed by using intermediate questions.
Net Promoter Score (NPS)
- Customer loyalty metric, 0-9 (or 1-10)
- “How likely is it that you would recommend our company/product/service to a friend or colleague?”
- NPS = percent_promoters - percent_detractors
- Responses get broken up into 3 groups
- Promoters (9–10). These are your happiest and most loyal customers who are most likely to refer you to others. Use them for testimonials, affiliates, etc. These customers are key to business growth and thereby sustaining their customer experience is critical to the brand.
- Passives or Neutrals (7–8). These customers are happy but are unlikely to refer you to friends. They may be swayed to a competitor fairly easily. A business should look at ways and means of upgrading neutrals to promoters by understanding their requirements.
- Detractors (0–6). Detractors are unhappy customers who can be dangerous for your brand, spreading negative messages and reviews. Figure out their problems and fix them.
- Any NPS that is positive is usually perceived as good, and an NPS score of 50+ is considered excellent. The range of NPS is from -100 (all detractors) to +100 (all promoters).
- **Don’t use as a single predictor of customer loyalty**
- A customer might actually be very enthusiastic about the product, but they just might not ever feel the urge to recommend hemorrhoid cream to their pals
- Combine with other measures
- Ask follow-up questions.
- Promoters. What’s your favorite part about our product/service?
- Passives. What would make you love us?
- Detractors. What could we do to improve your experience?
- Combine it with user research.
- Usability testing and other common conversion research techniques
- User testing
- Customer surveys
- Live chat
- Heat maps (e.g. buttons clicked on websites, scrolling actions)
- Find and fix issues.
- Use info to prioritize projects that enhance user experience
- Market to promoters. Use Promoters, Passives, and Detractors as a segmentation tool.
- Give free stuff to “promoters” to incentize more buying or advocates to others by sharing on FB or twitter or write a review.
- Find correlations between certain product actions (heatmaps) and a higher NPS. This can help deduce what your product’s “magic moment” is when your users are truly activated and likely to derive delight from your product. Then you can focus on product optimizations to get more of your customer base to this point
- Ask follow-up questions.
- Issues
- Response rate for surveys is relatively low
- Time-consuming and costly affair to collect a sizeable amount of survey data
- Relatively high-cost outlay associated with sending out surveys
- Responses are typically quantitative. There is rarely qualitative information explaining the reason for the response
- Alternative: Use sentiment analysis on customer reviews and social media posts to generate a proxy for NPS based on sentiment scores.
Response Biases
- Acquiescence Bias
- A tendency to agree with statements rather than disagree
- Occurs with Agree/disagree (A/D) or Yes/No (Y/N) questions
- Effects can be stronger when the survey is administered by a person compared to self-administered surveys
- Some people’s personal inclination can lead them to be polite and avoid conflict, ultimately being aggregable.
- Some participants may consider themselves in lower social status than the interviewer/researcher. Therefore, they may believe what is offered in questions and unintentionally accept the ‘agree’ choice.
- In many cultures, while interacting with another person, agreeing is more well-suited than disagreeing
- Can cause a correlational relation between similarly worded questions, thus, eliminates some important constructs
- Even a small survey error stemming from acquiescence bias decreases the quality of the inferences
- Solution:
- Convert Agree/Disagree (A/D) response format to item-specific (IS) response format
- Example
- Response Order Effect
- Choices presented earlier are more probable to be selected
- If the answer options are categorical, respondents tend to conceive them consecutively
- Effect is relatively small in rating scales
- Some respondents stop when they come to an acceptable answer and never see the rest of the options.
- If respondents spend more time on the first half of the response scale, they are more likely to choose one of the answers here.
- Solution:
- If using Agree/Disagree (A/D), convert to item-specific (IS) response format
- Respondants spend more time on IS format thus more likely to read all the anwsers
- Change the order of the responses randomly for different participants
- Some platforms like Survey Monkey and Qualdtrics websites have a randomize response order option
- Effect is smaller in vertical arrangement of responses
- If using Agree/Disagree (A/D), convert to item-specific (IS) response format
- Cognitive Errors
- Understanding the question
- Provide definitions for key terms in the questions
- Retrieval of information (Remembering)
- Unless it’s something really memorable, don’t ask about something that happened 6 months ago
- Use memory cues
- like sequencing the questions as the events would’ve been sequenced
- eliciting life events in the question
- Somethings are encoded into memories
- When we paid cash, we paid more attention to prices of certain items, because we had to get out the cash and count it. Being able to just swipe a card doesn’t encode such information as well.
- Integration of that information into an estimate or judgment
- Participants may underreport or overreport a behavior when the frequency is asked
- Reporting of that judgment (picking a response)
- There’s a cognitive burden when a respondant tries to bin there answer into one of the provided responses
- Greater burden with Agree/Disagree (A/D) format
- item-specific questions are less sequential compared to A/D questions. Thus, respondents may experience less burden on the cognitive process of reporting an answer
- Understanding the question