Observable
Misc
- Notes from
- Packages
- {robservable} - Allows the use of Observable notebooks (or parts of them) as htmlwidgets in R
- {Duckplot} - Open-source JavaScript library that allows you to quickly generate charts with Observable Plot when working with DuckDB.
- Resources
- Observable Plot Docs
- Use
ctrl+kto search for a type of chart
- Use
- Framework Docs
- Quarto
- Observable for R users
- Rennie intro to plotting in Quarto with Observable Plot with a scatter plot example
- Observable Plot from ggplot2
- Side by Side comparison of Observable and ggplot symantics
- Observable Plot Docs
- Free Tier
- Securely host 1 data app (private or public)
- Iterate and explore your data in (unlimited) public or private notebooks
Notebook
Notebook 1.0
- A collaborative, online notebook platform that comes with libraries loaded to make it fairly straightforward to dive into ad hoc data analysis or produce complete reports.
- In Observable, if you’re running a JavaScript cell that contains more than just a simple variable assignment (like
myVariable = 'Hello World'), you need to run a code block (i.e. bracket lines of code in curly braces, {}). - You can open your notebook in Safe Mode and edit your work without running it.
- Good for debugging (e.g. infinite while-loops)
- If you change code in one cell, it automatically updates other cells that depend on it. So, no need to rerun cells that depend on the cell with the changed code
- Example: EDA Workflow
- From Account’s Home Page \(\rightarrow\) Click New Notebook (top-right)
- Select a Workspace (Left Panel) \(\rightarrow\) (Optional) Select a Template (Middle) \(\rightarrow\) Click Create Notebook (Bottom Right)
- If no template selected, then a blank notebook with a markdown cell opens
- Add Data
- Click Files (Right Panel, Top)
- Choose File Attachments or Cloud
- File Attachments: Click or drag a file and drop into attachments area
- Create a Table
- To right of file name in the Attachments window there’s an icon. Click it and a table is created
- Create a Scatterplot
- Click the below the current cell to add a cell
- In pop-up window, type scatter in Filter window and click Scatterplot chart
- In Scatterplot code cell,
- Replace toy data name (e.g. cars) in code with the name of the cell that has your data
- Replace names in the x and y attributes with the names of the columns from your dataset
Notebook 2.0
- Notes from hrbrmstr’s summary and OHQ’s release
- Features
- Supports file-based workflows so you can do more with notebooks
- Adopts vanilla JavaScript so notebooks are easier to learn, use, & reuse
- Modernizes notebooks to support the latest syntax & libraries
- Render notebooks as fast static sites for the best reading experience
- Notebooks are now regular HTML files that live on your computer
- Uses regular JavaScript (though OJS is still supported), so anything you write can be used in other web or Node.js projects without modification
- Pre-render everything at build time, creating fast-loading pages without delays.
- The old system did all the computation in your browser when you visited a page, which was great for interactive exploration but slow for production dashboards that lots of people might visit.
- Collaboration has shifted from real-time editing in the browser to the standard software development approach of working with local files, branches, and pull requests
Framework
Static Site Generator (SSG) for data apps (e.g. dashboards)
This is essentially a {flexdashboard}/Quarto dashboard where everything is in html files which are served to the user. I think the big difference is the native reactivity you get with JS. You can use {flexdashboard}/Quarto with {shiny} but that requires a shiny server instead of a stand alone html file.
- Additionally it can be easily deployed to ObservableHQ which has built-in activity monitoring.
- In the workspace next to the app name, click on the to see the user stats
- No users names for public applications. For private applications, you will see user names.
- Can also be deployed in other places
- Additionally it can be easily deployed to ObservableHQ which has built-in activity monitoring.
Misc
Data Loaders - Generate data from code which then become part of the site.
- This can be a shell (.sh), R, Python, or Rust script, etc. that downloads a data file and gets converted into a parquet file.
- Preprocessing code can also be included.
The extra space on the right-side of apps is for a TOC. When using h2 or greater tags (e.g. ##, ###), those sections will show up in a TOC in a panel
- To remove this space:
- Open
observablehq.config>> Scroll to the bottom where you see // toc: true - Remove “//” and replace true with false (e.g. toc: false)
- Open
- To remove this space:
Advantages of SSG
- Speed - App doesn’t have to be continually rebuilt. Database doesn’t have to be repeated queried (See below)
- Cost - Database is not continuously queried since it’s sent to the user in the form of a parquet file.
- Hosting - HTML files can be hosted from anywhere (even an S3 bucket).
- Security - With Dynamic website serving, code is constantly being ran to build the dashboard and query databases. These process are common attack vectors. With SSG, only files get served.
- Robustness - SSG has fewer moving parts which means fewer things can break
Traditional BI app architecture (Dynamic Websites)
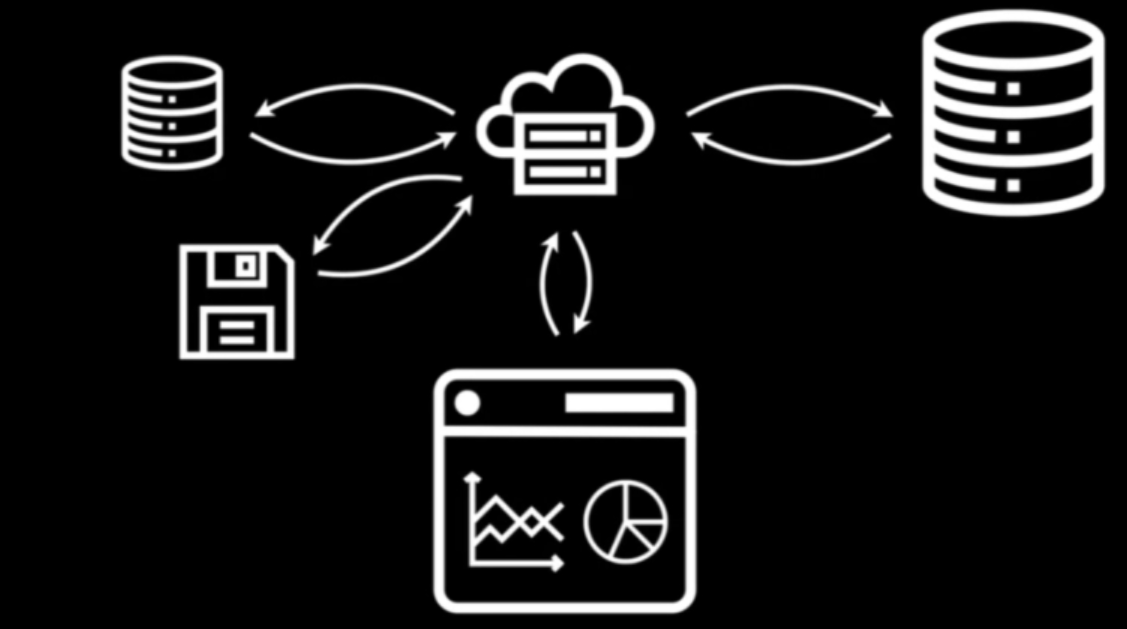
- Webserver (top-mid) in the cloud gets code to build the dashboard from disk (bottom-left) or from a database (top-left)
- Webserver gets the data from a database (top-right)
- Webserver serves dashboard to user’s browser (bottom-center).
- User performs an interaction which gets sent to the webserver and those process begins anew.
SSG approach
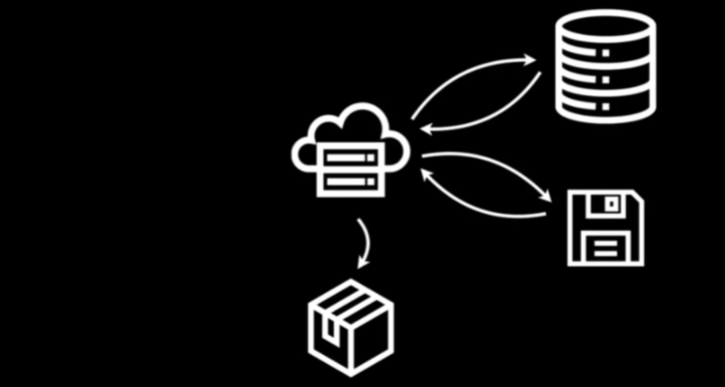
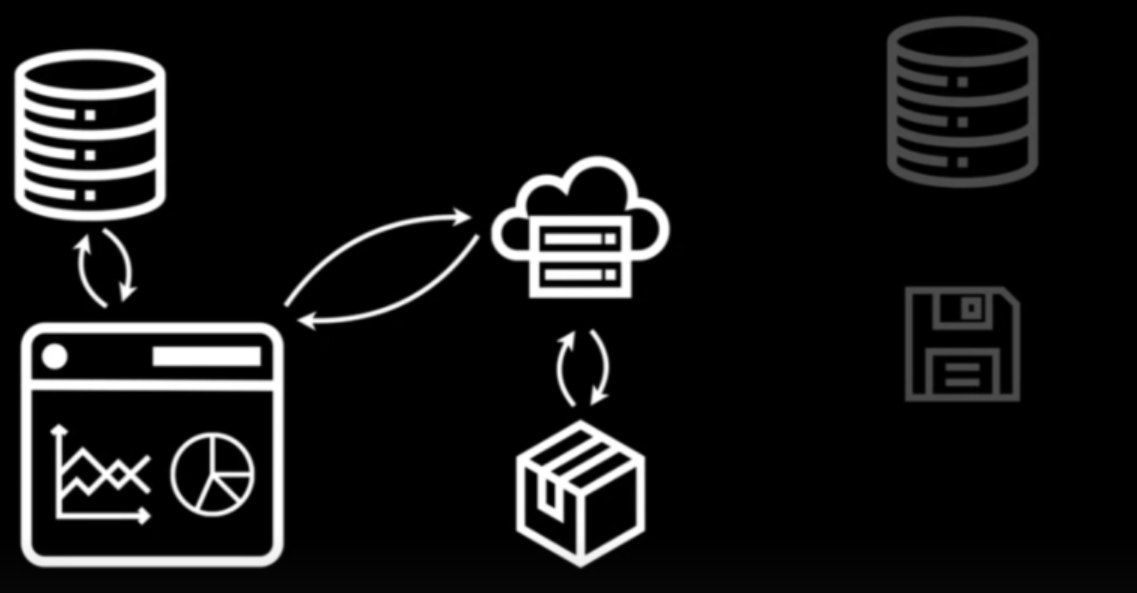
- (Left) Webserver (top-mid) in the cloud gets data and code to build dashboard from a database (top-left) and disk (bottom-left) and packages both components (bottom-mid)
- (Right) Webserver gets dashboard from package and serves it to the user’s browser
- (Right) User performs an interaction which gets sent to the webserver. Webserver generates the new dashboard from the package and serves it to the user’s browser.
- (Right) Part of the package that gets sent to user can be a database (e.g. duckdb, sqlite) which can get queried directily in the browser.
Example: Basic App and Workflow in VS Code
Initiate and create the barebones from terminal
npx @observeablehq/framework@latest createThen you go through a series of prompts
- Where to create project? For current directory:
./my_project - Project title?
- Include sample files? (i.e. examples to get you started)
- Install dependencies? Choices: npm, yarn, or no
- Initialize git repository?
- Observable doesn’t store the code — just the build, so it’s a good idea to back-up the code somewhere.
- e.g.
cd my_project - In this example, the project is called “penguins” and the
requirements.txt,penguins.csv, and predictions.csv.pyare files not included in the initiation of the projectpenguins.csvis the static data file to be used inside dataloader file- It can be dragged (in VS Code) from outside the project directory to inside the
srcdirectory
- It can be dragged (in VS Code) from outside the project directory to inside the
requirements.txtis the file with the python libraries that’ll be used to transform the data (can also be a model that outputs predictions).- It can be dragged (in VS Code) from outside the project directory to inside the project’s root directory
predictions.csv.pyis the dataloader file

- The
.csvin the files name indicates the file type of the output - This can be data transformation code or a model with predictions or just about anything
- In this example, it’s a logistic regression model outputting predictions
- The
package.jsonis for defining all the js (?) packages you want to use- Any npm module can be added to your application
src>>index.mdis the dashboard layout file (e.g. chart code, html divs, etc.)
Install dataloader dependencies (e.g. python)
python3 -m venv env
source env/bin/activate
pip install -r requirements.txt
Start a preview server from terminal
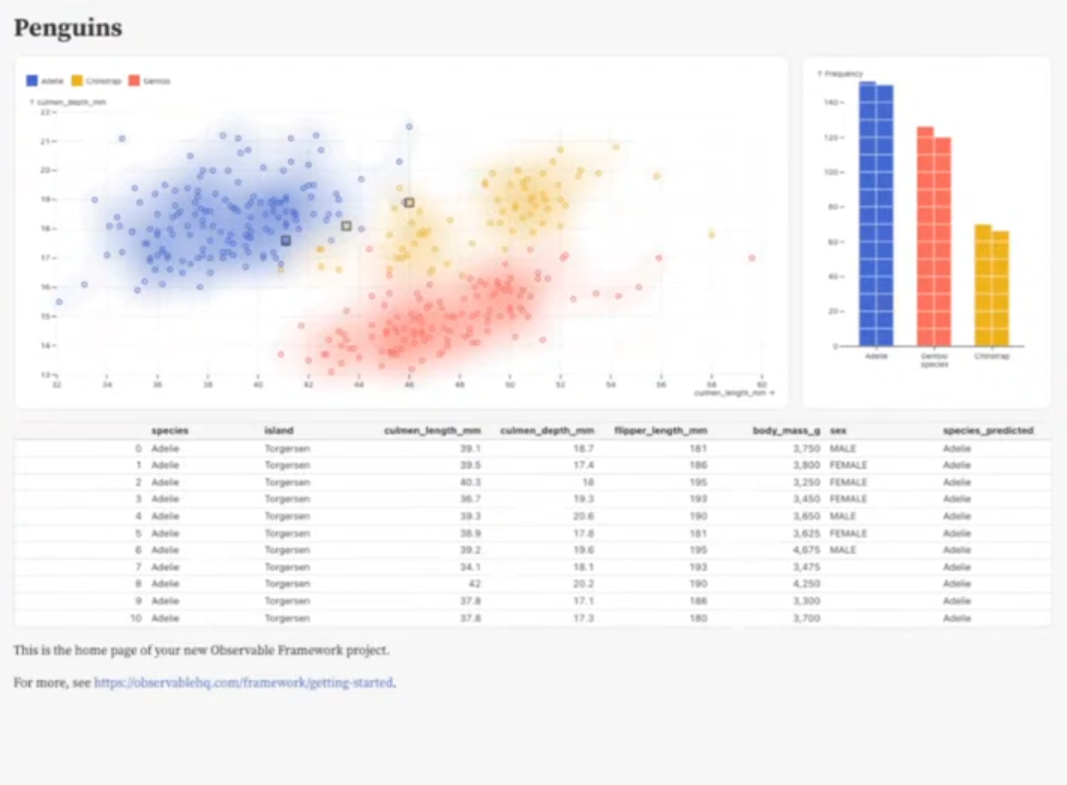
npm run dev--- theme: dashboard --- # Penguins ``` js const penguins = FileAttachment{'./predictions.csv'}.csv({typed: true}); ``` // charts in horizontal div <div class="grid grid-cols-4"> <div class="card grid-colspan-3">${resize((width) => scatterplot(penguins, {width}))}</div> <div class="card grid-colspan-1">${resize((width) => waffleplot(penguins, {width}))}</div> </div> // table <div class="card" style="padding: 0px"> ${Inputs.table(penguins)} </div> ``` js function scatterplot(data, {width} = {}) { return Plot.plot({ grid: true, nice: true, color: { legend: true }, width, marks: { Plot.dot(penguins, { x: "culmen_length_mm", y: "culmen_depth_mm", stroke: "species" }), Plot.density(penguins, { x: "culmen_length_mm", y: "culmen_depth_mm", fill: "species", fillOpacity: 0.05 }), // shows the incorrectly predicted points Plot.dot(data, { filter: (d) => d.species !== d.species_predicted, x: "culmen_length_mm", y: "culmen_depth_mm", r: 6, symbol: "square", stroke: "currentColor" }) } }) } ``` ``` js function waffleplot(data, {width} = {}) { return Plot.plot({ width, marks: { Plot.waffleY( penguins, Plot.groupX( { y: "count" }, { x: "species", fill: "species", unit: 5, sort: { x: "y", reverse: true } } ) ), Plot.ruleY([0]) } }) } ```- Running file with chart code for the first time will result in the installation of D3, observable plot, and other libraries necessary to create that chart. It won’t install the whole observable ot library — just the bits necessary to create the chart(s).
FileAttachmentloads the data and thecsvwith typed: true guesses the column types. The default is typed: false which assumes all columns are strings.- Temporarily adding a js cell with
display(predictions.csv)and running the file will display the data in a json format in the preview server if you want examine it.
- Temporarily adding a js cell with
- Plots are made into functions so that they can be called inside HTML divs
Inputsfor the table is something already available in Framework or maybe it’s Plot- class=“grid” and class=“card” are classes already available in Framework
- grid-cols-4 says create 4 columns
- grid-colspan-3 makes the scatter plot take 3 out of the 4 columns (i.e. 3/4 of total width)
- grid-colspan-1 makes the waffle plot take 1 out of the 4 columns (i.e. 1/4 of total width)
resizewithin each div make the container react to the size of the window (e.g. mobile).- Passing the width parameter into the plot functions allows the plot functions to adjust to the size of the plot to the size of the container (i.e. plot fills container and justs to size of window)
- Make sure to include width in each plot’s arguments and within the function.
npm run observable deploy- Then you go through a series of prompts
- Must be logged in, so it’ll ask if you want to log in. (for the first deployment)
- It gives you a URL and a confirmation code.
- Go to the URL and make sure the confirmation code matches, click continue, the click authorize your device.
- Choose the observable workspace to deploy to.
- Choose a current project or to create a new project.
- What “slug” do you want to use? (I think this just means what name do you want the project to have.)
- Public or Private?
- Build again before deployment?
- Probably good practice to do so.
- What changed in this deploy? (Same thing as a commit message)
- Must be logged in, so it’ll ask if you want to log in. (for the first deployment)
- It gives you a link for the app once it’s deployed.
- Where to create project? For current directory:
Quarto
Misc
- Notes from Observable for R users
- Resources
- The Observable documentation has an interactive colour palette viewer, where you can browse different sequential, diverging, and discrete colour palettes.
- The built-in options include the ColorBrewer palettes, which are also available in R.
- Importing a notebook from ObservableHQ
- The Observable documentation has an interactive colour palette viewer, where you can browse different sequential, diverging, and discrete colour palettes.
- Plot (and other libraries) requires data to be in by-row format, but
ojs_defineloads data in by-column format, so remember to usetransposeon your data before using these plotting libraries.By-Column
{
  "year": [1958, 1959, 1960],
  "max":  [317.51, 318.29, 320.04]
}
By-Row
[
  { "year": 1959, "max": 317.51 },
  { "year": 1960, "max": 318.29 },
  { "year": 1960, "max": 320.04 }
]
- Capturing the plot output
- Use the
webshotfunction from {webshot2} via the CSS selector to capture the Observable cell output where selector = “.cell-output.cell-output-display”
- Use the
Loading data into Observable
From a file
```{ojs} data = { const co2data = await FileAttachment("co2_mm.csv") .csv({ typed: true } ); return co2data.map(d => { d["decimal date"] = Number(d["decimal date"]); d.average = Number(d.average); return d; }); } ```- Recommended to specify typed: true. Enables d3.autoType to be used to automatically detect numbers, dates, etc. and convert them to the correct JavaScript types.
- Available file types: csv, tsv, json, sqlite, arrow feather (v2 and uncompressed)
- Also methods for blob (geospatial), text, stream, and image (see article)
- Example:
arrow::write_feather(mtcars, "data.arrow", compression = "uncompressed")
From an R or Python chunk
```{r} ojs_define(r_data = plot_data) ```- Where plot_data is data that’s been cleaned in a previous R chunk
- r_data isn’t an argument either. It can be any name you want
From an API (source)
```{ojs}
d3 = require('d3')

contributors = await d3.json(
  "https://api.github.com/repos/pandas-dev/pandas/stats/contributors"
)

commits = contributors.map(contributor => {
  const author = contributor.author;
  return {
    name: author.login,
    title: author.login,
    group: author.type,
    value: contributor.total
  }
})
```
Import Libraries
```{ojs}
d3 = require("d3@7")
```
Scatterplot
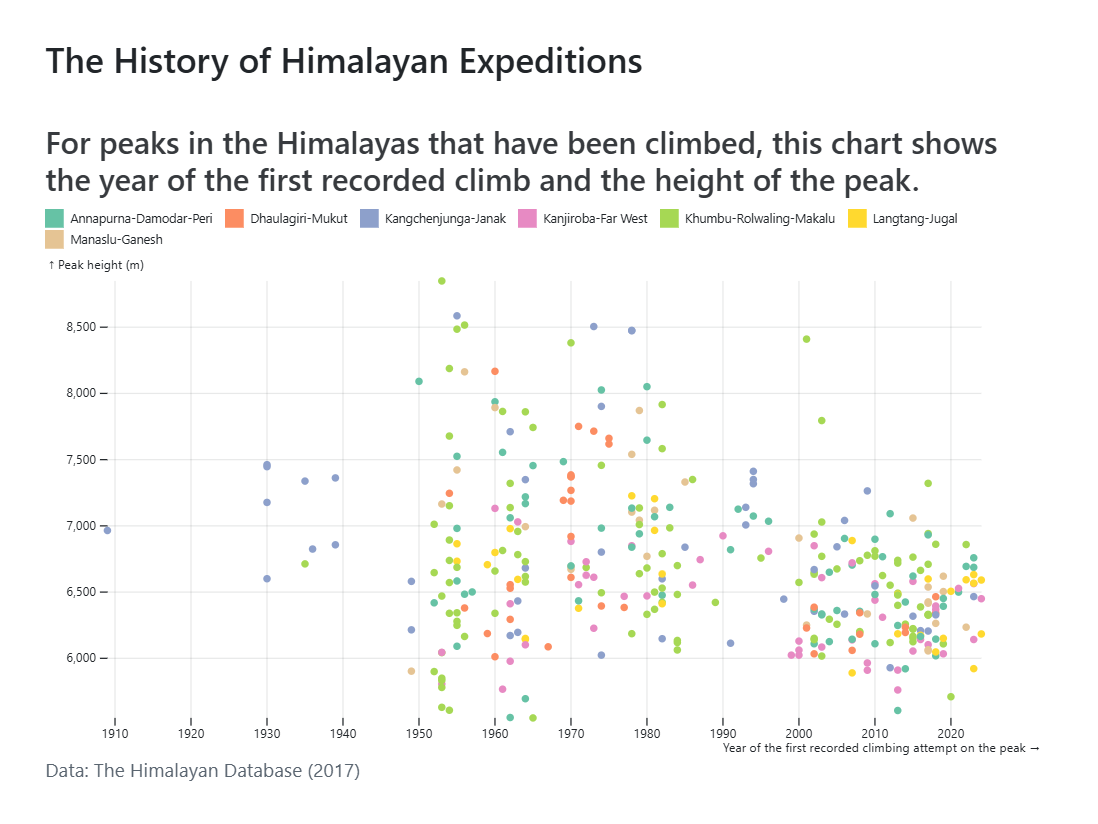
```{ojs} data = transpose(r_data) dataTyped = data.map(({ PYEAR, HEIGHTM, REGION_FACTOR }) => ({ PYEAR: new Date(PYEAR, 0, 1), HEIGHTM, REGION_FACTOR })) Plot.plot({ // Draw points marks: [ Plot.dot(dataTyped, {x: "PYEAR", y: "HEIGHTM", fill: "REGION_FACTOR"}) ], // Colours color: {legend: true, scheme: "set2"}, // Grid and axes styling grid: true, x: {label: "Year of the first recorded climbing attempt on the peak"}, y: {label: "Peak height (m)"}, // Text title: "The History of Himalayan Expeditions", subtitle: "For peaks in the Himalayas that have been climbed, this chart shows the year of the first recorded climb and the height of the peak.", caption: "Data: The Himalayan Database (2017)", // Size height: 400, width: 800, marginLeft: 50, marginRight: 50 }) ```- The date variable needs to be a Date type else Plot will treat it like a numeric variable and the x-axis labels will just be numbers.
- marks defines the geometries that are drawn such as lines or dots
- set2 is a discrete color palette that comes with Plot (See Misc for a link to the availabe palettes)