A/B
Misc
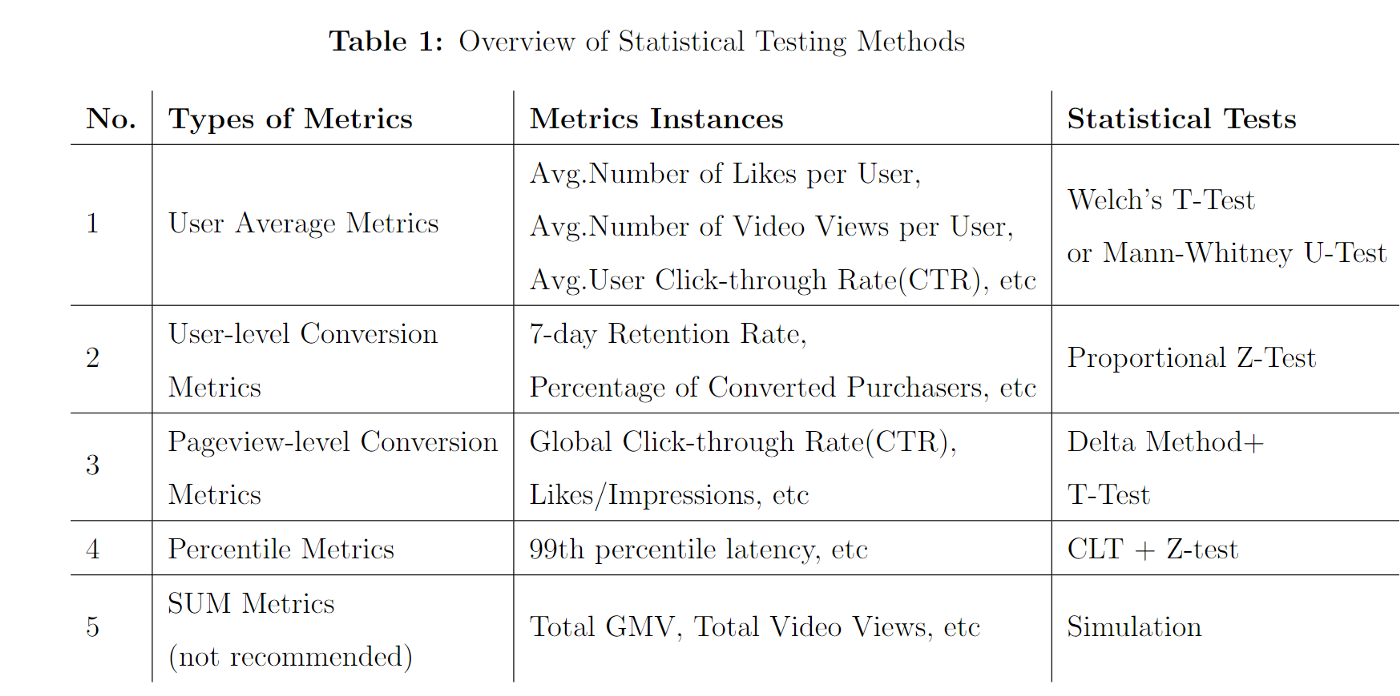
- Notes from: How to Select the Right Statistical Tests for Different A/B Metrics
- Also see
- Post-Hoc Analysis, general >> Frequentist
- Experiments, A/B Testing >> Workflow >> Post-Experiment - Analyze the Results
- Experiments, A/B Testing >> Potential Biases
- Packages
- {avlm} (paper) - Anytime-valid inference for linear models, namely, sequential t-tests, sequential F-tests, and confidence sequences with time-uniform Type-I error and coverage guarantees.
- Allows experiments to be continuously monitored for significance, stopped early, and safeguards against statistical malpractices in data collection
- Paper shows a Netflix usecase
- {deltatest} (repo) - Statistical Hypothesis Testing Using the Delta Method
- In online A/B testing, we often face a significant practical challenge: the randomization unit differs from the analysis unit. Typically, control and treatment groups are randomly assigned at the user level, while metrics—such as click-through rate—are measured at a more granular level (e.g., per page-view). In this case, the randomization unit is user, but the analysis unit is page-view. Consequently, the data may exhibit within-user correlation, thereby violating the i.i.d. assumption.
- When the standard Z-test is applied to such correlated data, the resulting p-values do not follow the expected uniform distribution under the null hypothesis. As a result, smaller p-values tend to occur more frequently even when there is no true difference, increasing the risk of falsely detecting a significant difference.
- This package implements a modified statistical hypothesis testing method that replaces the standard variance estimation formula in the Z-test with an approximate formula derived via the Delta method, which accounts for within-user correlation.
- {avlm} (paper) - Anytime-valid inference for linear models, namely, sequential t-tests, sequential F-tests, and confidence sequences with time-uniform Type-I error and coverage guarantees.
- Some business metric distributions significantly differ from the nice uni-modal normal/student-t distribution
- Ask
- Does the sampling distribution match the assumption (e.g. independence, normality, etc.) of the proposed test methods?
- Does the randomization unit align with the analysis unit?
Metrics
- User Average Metrics
- Indicators that average the total business performance by the number of unique users
- Examples
- Average number of likes per user
- Average stay time per user during the experiment period.
- Examples
- Indicators that average the total business performance by the number of unique users
- User-level Conversion Metrics
- Metrics out of binary outcomes, 1/0
e.g
\[ \text{conversion rate} = \frac{\text{\# of converted users}}{\text{\# of all users}} \]
- Metrics out of binary outcomes, 1/0
- Pageview-Level Conversion Metrics
e.g.
\[ \mbox{click-through rate (CTR)} = \frac{\mbox{\# of click events}}{\mbox{\# of view events}} \]
The essential problem is that the unit of analysis (i.e. event level — click events and impression events) is different from the unit of randomization (i.e. user level), which could invalidate our t-test and underestimate the variance.
- Since each sample observation is a view event, we need to ensure all the view events are independent. Otherwise, we are not able to use CLT to assert normality for our mean statistics.
- In A/B experiments where we randomize by users (this is usually the default option because each user would have an inconsistent product experience if we randomize by sessions), a user can have multiple click events or view events, and these events will be correlated.
- Therefore, sample variance will no longer be an unbiased estimate of the population variance
- Can result in spuriously low p-values
Delta method converts the pageview metric to a user-level metric where independence and iid assumption hold
\[ \begin{aligned} &t = \frac{\left(\frac{\bar X_1}{\bar Y_1} - \frac{\bar X_2}{\bar Y_2}\right)-0}{\sqrt{\frac{\mbox{Var}(\frac{\bar X_1}{\bar Y_1})}{n_1} + \frac{\mbox{Var}(\frac{\bar X_2}{\bar Y_2})}{n_2}}} \\ &\mbox{where} \; \bar X = \frac{\mbox{\# of clicks}}{\mbox{\# of users}}, \; \bar Y = \frac{\mbox{\# of views}}{\mbox{\# of users}}, \\ &\mbox{and} \; \mbox{Var}\left(\frac{\bar X}{\bar Y}\right) = \frac{\mathbb{E}(Y)^2\mbox{Var}(X) - 2\mathbb{E}(X)\mathbb{E}(Y) \mbox{Cov} (X, Y) + \mathbb{E}(X)^2 \mbox{Var}(Y)}{\mathbb{E}(Y)^4} \end{aligned} \]- Article with py code
- With the correct variance, you can perform the t-test and get the p-value
Bootstrap method - Repeatedly draw many samples from all the view events in each group stratified by user ids, then calculate many mean statistics from these bootstrap samples, and estimate the variance for these statistics accordingly.
- Stratifying by user ID ensures i.i.d. assumption is met and the variance estimation is trustworthy.
- Computationally expensive as the simulation is basically manipulating and aggregating the tens of billions of user logs for many iterations (Complexity ~ O(nB) where n is the sample size and B is the number of bootstrap iterations).
- With the correct variance, you can perform the t-test and get the p-value
- Percentile Metrics
- Many business aspects are characterized by edge cases and thus are better described by quantile metrics
- e.g. 95th percentile page load time/latency
- Issue is that some of these defined at the Pageview level and not at the user-level (i.e. randomization level)(For more details, see Pageview-level Conversion Metrics)
- Bootstrap method - Use to estimate the empirical variance and t-test the sample means of percentile metrics ((For more details, see Pageview-level Conversion Metrics)
- Proportional Z-test
- For details, see the article and Ch 8.6 of Causal Inference and Its Applications in Online Industry
- Many business aspects are characterized by edge cases and thus are better described by quantile metrics
- Sum Metrics (Not Recommended)
- Aggregated counts
- e.g. total number of the article read, the total Gross Merchandise Value (GMV), the total videos posted
- Article says these sum metrics are problematic because of business fluctuations (user average metrics) and by the inevitable random error introduced by the traffic diversion
- I don’t know what this means and the article didn’t explain it well.
- There may be a better explanation in the book in the previous section
- There are also references at the end of the article
- Recommended to test the effectiveness/statistical significance of the product feature using a user average metric and calculating the incremental lift in the SUM metrics
- Aggregated counts
Bayesian
- Misc
- Packages:
- {bayesAB} - Independent Beta Estimation (IBE)
- {abtest} - Logit Transformation Testing (LTT)
- {bartCausal} - Bayesian Additive Regression Trees (BART)
- No website or vignettes so see bkmks (Algorithms >> Decision Tree/Random Forests >> Bayes) for articles, papers
- 1st or 2nd in causal competitons from 2016 to 2022
- Packages:
- Versus Frequentist Analysis
- Differentiates between different hypotheses and can prove the absence of an effect (e.g., A and B do not differ) in light of the data. A low p-value however is only indirect evidence suggests that the data are too inconclusive or not odd enough to reject the null hypothesis.
- “Differentiates between different hypotheses” - Maybe this has something do with working with distributions in Bayesianism
- Informs economic decision-making. Because frequentist statistics do not estimate the probability of parameters (e.g., conversion rate for A vs. B), we cannot translate it back into relevant business outcomes like expected profit or survival rates.
- Is truly intuitive or straightforward to non-stats people. It naturally complements the human way of thinking about evidence. For Frequentists, the interpretation of probability is reversed which makes it a pain to understand directly.
- Bayesian updating is more intuitive and thus easier to explain than p-values (i.e. imagine a universe where the null hypothesis is true, then…)
- Requires much less data and is more time-efficient. Unlike frequentist statistics, Bayesians do not follow a sampling plan that would make an analysis of existing data illegitimate before the full sample size is reached. (?)
- Differentiates between different hypotheses and can prove the absence of an effect (e.g., A and B do not differ) in light of the data. A low p-value however is only indirect evidence suggests that the data are too inconclusive or not odd enough to reject the null hypothesis.