Production
Misc
- Packages
- {shiny.router} - Route inputs to different webpages
- Basics, Basic navbar routing
- Use Cases: custom navbar, A/B testing, Different UI for mobile users
- {shiny.router} - Route inputs to different webpages
- Resources
- Considerations
- Costs: Hosting, Licensing, Support
- Maintenance: Updates, Monitoring, Scaling
- Monitoring
For Shiny, if you want to read
config.ymlin one place and have your entire app know about it you need to explicitly put it in the global environment.GlobalEnv$cfg <- config::get()
Docker
Misc
- Packages
- {deps} (article)
- Lightweight method that installs packages via a DESCRIPTION json file
- Blend between package and renv approaches to dependency management
- Project scripts contain roxygen-like, decorator code about packages and those are used to build the DESCRIPTION json file
- Image size should be similar to the “deps/DESCRIPTION” method above
- Lightweight method that installs packages via a DESCRIPTION json file
- {shinydocker} (Intro, tutorial) - Containerizes Shiny applications by automatically generating Docker configurations, building images, and managing containers. It supports both R and Python Shiny apps with intelligent detection of app type and dependencies.
- {deps} (article)
Images
- Images have a 2GB limit
- Base Image Build Times
.png)
- Smaller images take longer to load because all the packages/libraries have to be compiled
- rstudio/base, rocker/shiny, rocker/r-ubuntu use binary packages
- rocker/r-bspm and eddelbuettel/r2u uses binary packages and apt-get
- Order of Image Layers
.png)
- Order is bottom to top when writing your dockerfile. (see example below)
- Important for the bottom layers to be things that you might change most often. This way you don’t have to reinstall R everytime you change something in your app code.
Dockerfiles
Example 1
From rocker/r-base:4.0.4

RUN apt-get update && apt-get install -y \
    --no-install-recommneds \
    make libssl-dev libxml2-dev \
    && rm -rf /var/lib/apt/lists/*

COPY Rprofile.site /etc/R
RUN install.r shiny ggplot2 htmltools plotly

RUN addgroup --system app && adduser --system --ingroup app app
WORKDIR /home/app
COPY app .
RUN chown app:app -R /home/app
USER app

EXPOSE 3838
CMD ["R", "-e", "shiny::runApp('/home/app', port = 3838, host = '0.0.0.0')"]
Example 2 (source)
# Use the official R base image
FROM rocker/r-ver:4.3.1

# Install system dependencies (if needed)
RUN apt-get update && apt-get install -y \
    libcurl4-openssl-dev \
    libssl-dev \
    libxml2-dev \
    && rm -rf /var/lib/apt/lists/*

# Set the working directory
WORKDIR /usr/src/app

# Copy your project files
COPY . .

# Install R dependencies
RUN Rscript -e "install.packages('renv')"
RUN Rscript -e "renv::restore()"

# Define the entry point
CMD ["Rscript", "app.R"]
Dependencies
Methods (article)
# Explicit RUN install.r shiny ggplot2 htmltools plotly # DESCRIPTION file RUN install.r remotes COPY DESCRIPTION . RUN Rscript -e "remotes::install_deps()" # renv package RUN install.r remotes renv COPY ./renv.lock . RUN Rscript -e "options(renv.consent=TRUE); renv::restore(lockfiile='/home/app/renv.lock')"littler::install.r({littler} is installed on all Rocker images)
Image Size Comparison
REPOSITORY TAG SIZE analythium/covidapp-shiny renv 1.7GB analythium/covidapp-shiny deps 1.18GB analythium/covidapp-shiny basic 1.24GB- basic Image (aka “explicit” method): 105 packages installed
- deps Image (aka “DESCRIPTION” method): Has remotes added on top of these;
remotes::install_deps()to install packages from the DESCRIPTION file - renv Image: Has remotes, renv and BH as extras.
- BH seems to be responsible for the size difference, this package provides Boost C++ header files.
- Your app will probably work perfectly fine without BH.
- You can use
renv::remove("BH")to remove BH from the project or use the “custom” model and list all the packages to be added to the lockfile
Security
Example: Dockerfile
RUN addgroup --system app && adduser --system --ingroup app app WORKDIR /home/app COPY app . RUN chown app:app -R /home/app USER app- Best to create user groups and not run app as a root sudo
chown, an abbreviation of change owner, is used on Unix and Unix-like operating systems to change the owner of file system files, directories. Unprivileged users who wish to change the group membership of a file that they own may use chgrp
Compose
Example: With postgres and shiny server (source)
services:
   postgres:
      # a name, e.g.,  db_container is
      # instrumental to be
      # called as host from the shiny app
      container_name: db_container
      build: ./postgres
      restart: always
      environment:
         - POSTGRES_USER=postgres
         - POSTGRES_PASSWORD=postgres
      # This port mapping is only necessary
      # to connect from the host,
      # not to let containers talk to each other.
      ports:
         - "5432:5432"
      volumes:
         - "./pgdata:/var/lib/postgresql/data"
   shiny:
      container_name: shiny
      depends_on:
         - postgres
      build: ./shiny
      volumes:
         - "./shiny-logs:/var/log/shiny-server"
         - "./shiny-home:/srv/shiny-server"
      ports:
         - "3838:3838"
CI/CD
.png)
- Use github action for docker caching which builds the image and pushes your image to Docker Hub
- Then your compute instance (PaaS) pulls the image from that registry
Data Strategies
- Do as little processing as possible in the app
- Bundle datasets alongside the source code, such that wherever the app is deployed, those datasets are available.
- Drawback: data would need to be kept in version control along with your source code, and a new deployment of the app would be required whenever the data is updated.
- For frequently updated datasets, this is impractical, but may be valuable if those datasets are unlikely to change during the lifetime of a project.
- Excellent for small to medium datasets (realistically up to 2-3 GB in memory, with correct design)
- Drawback: data would need to be kept in version control along with your source code, and a new deployment of the app would be required whenever the data is updated.
- Keep data in cloud storage
- Allows collaborators to upload new data on an ad-hoc basis without touching the app itself. The app would then download data from the cloud for presentation during each user session
- Better for frequently updated datasets
- Optimization (loading in secs instead of mins)
- Use parquet file format
- Caching the data for the app’s landing page or use asynchronous computing to initiate downloading the data while presenting a less data-intensive landing page
- In the app, user inputs can query what they need rather than loading full datasets into memory
- Pipeline
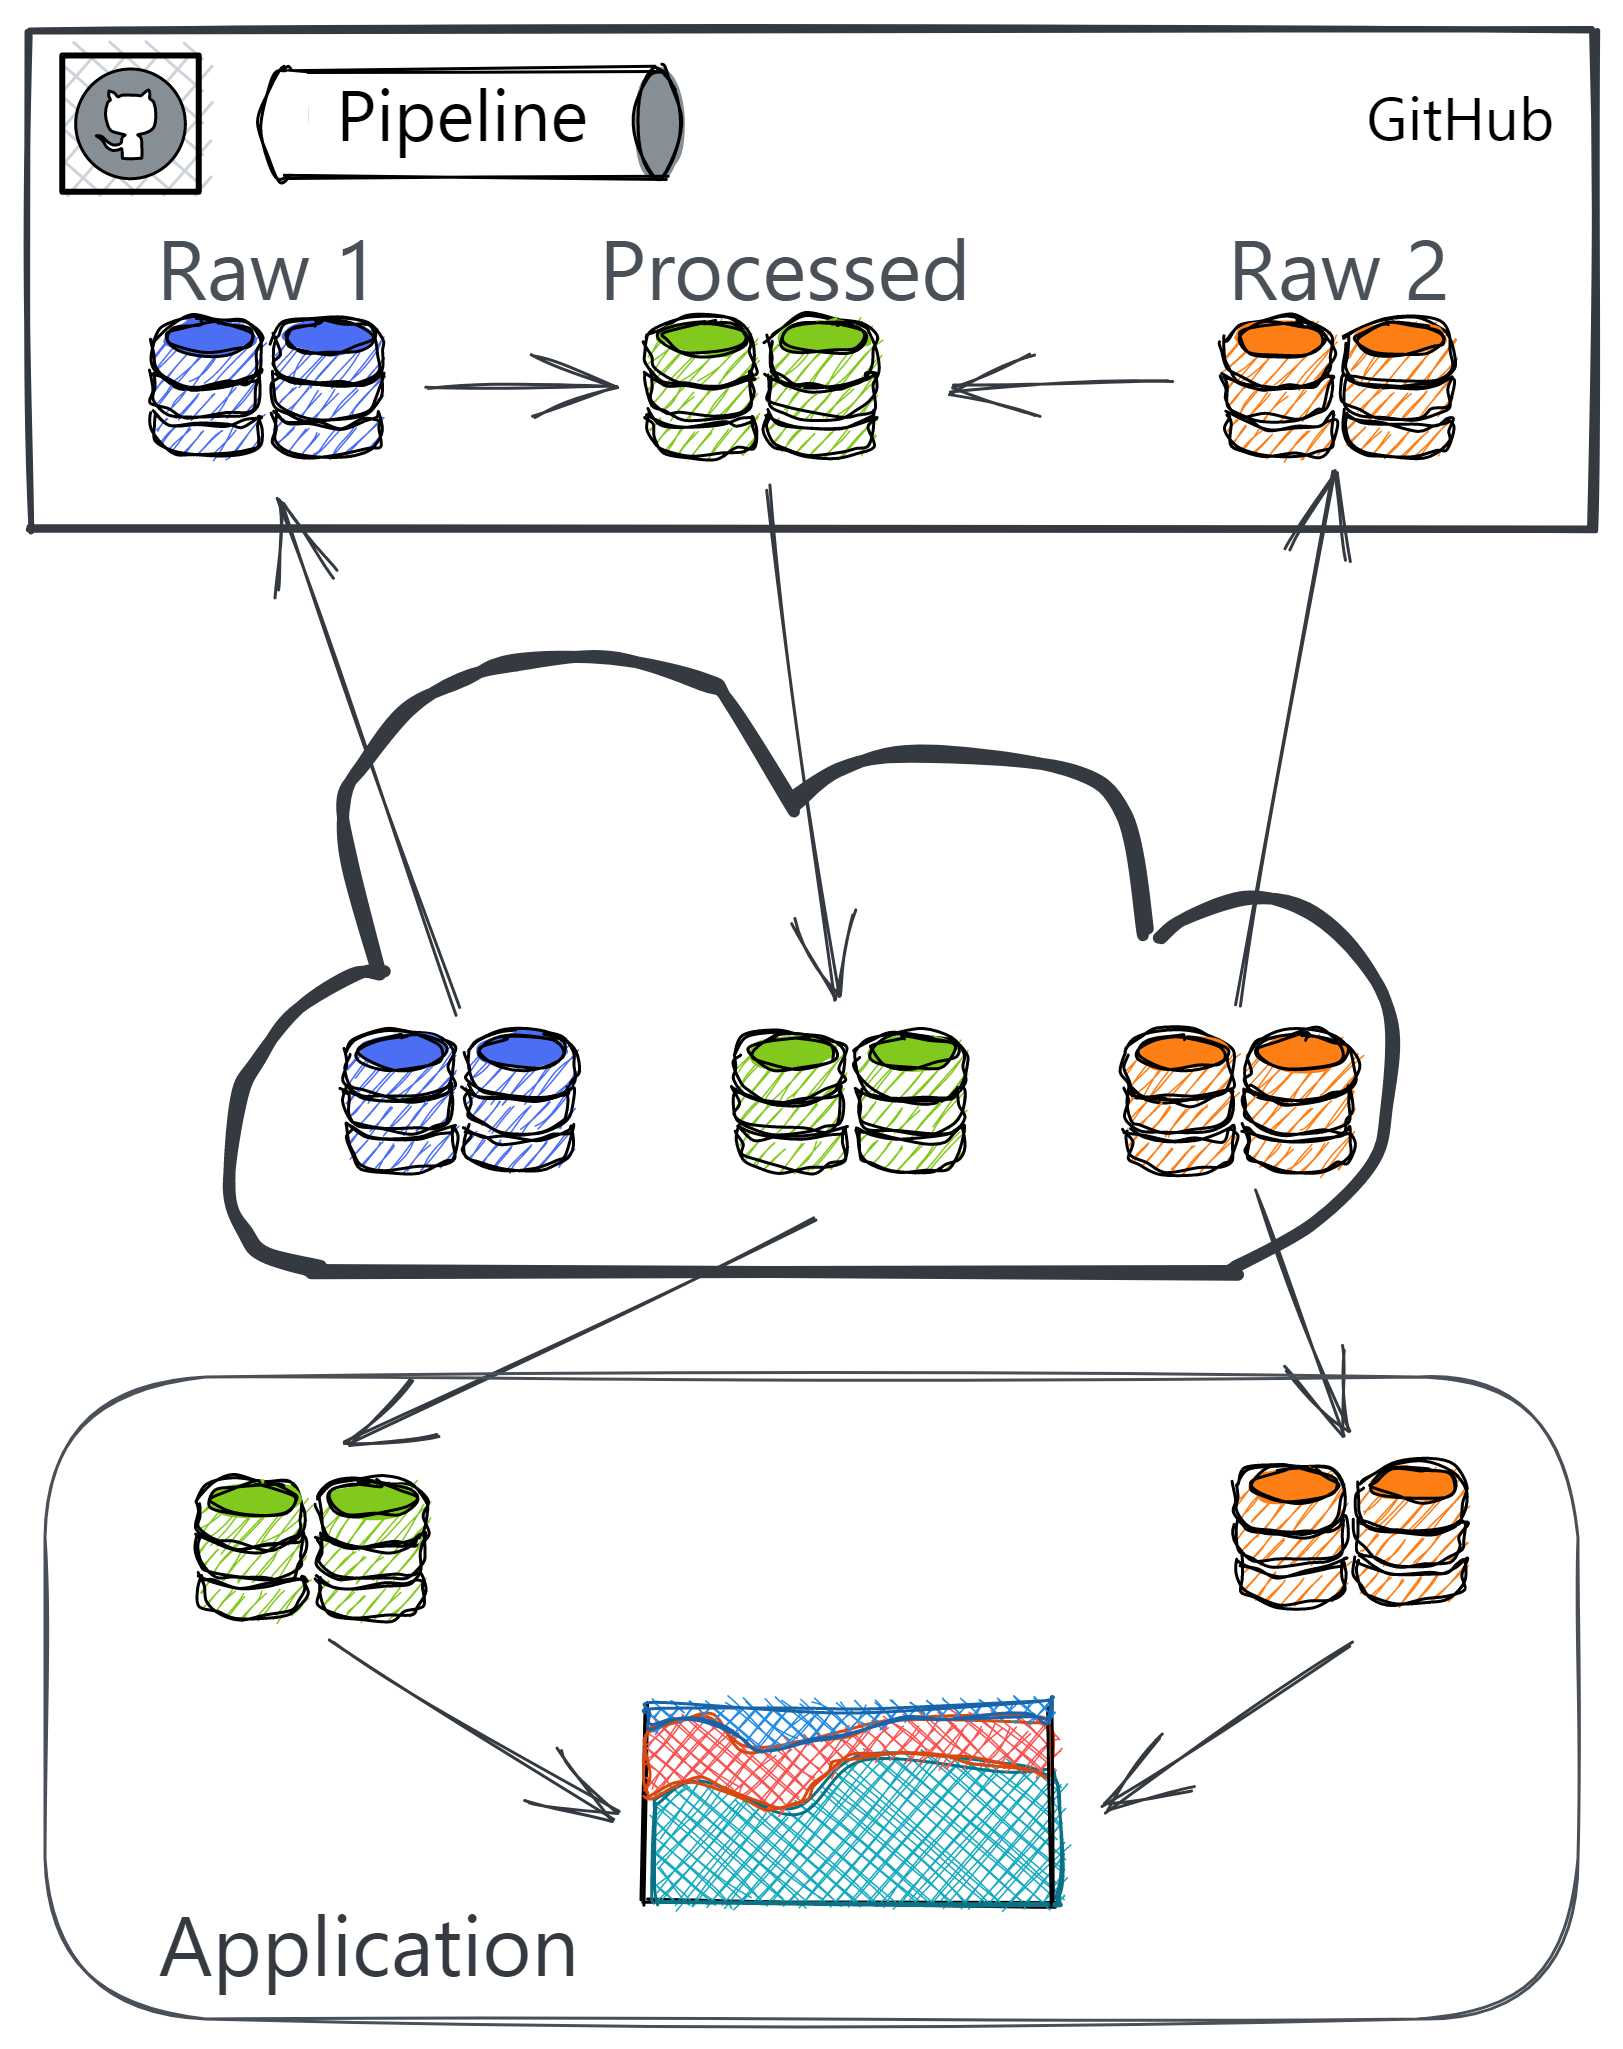
- Partition data:
- Raw data that is not computationally expensive or needs no processing
- Processed data that is more computationally expensive to process.
- The data processing pipeline is outside of the app. (e.g. GitHub Actions workflow)
- Data storage and app server should be in the same region to reduce latency
- Partition data:
- Create Pipeline Triggers
- When new raw data is uploaded, then data gets processed and into the app in a timely manner.
- When the source code for the app or the data processing pipeline change, the data processing pipeline should run afresh.
- If changes to the structure of the raw dataset mean that the data processing pipeline produces malformed processed data, there should be a way to log that.
- {pins}
Also see Databases, Engineering >> Misc >> {pins}
Packages
- {shinystate} - Enhance the bookmarkable state feature of ‘shiny’ with additional customization such as storage location and storage repositories leveraging the ‘pins’ package
Everytime the pin is updated,
pin_reactive_readalso updates the data within the shiny app- You can also set a fixed update time within the function
Example: How to use pins + Shiny for ever-changing data
board <-
  board_connect(server = Sys.getenv("CONNECT_SERVER"),
                key = Sys.getenv("CONNECT_API_KEY"))

name = "isabella.velasquez/shiny-calendar-pin"

server <- function(input, output, session) {

  reactive_pin <- pins::pin_reactive_read(name = name, board = board)

  r <- reactiveValues(all_data = NULL, filtered_data = NULL)

  observe({
    req(reactive_pin())
    all_results <- reactive_pin() |>
      as.data.frame() |>
      filter(!is.na(title) & !is.na(duedate)) |>
      rowid_to_column("id")

    r$all_data <- all_results
    r$filtered_data <- all_results
  })
}
- {shinypayload}
- Technical Description
- Adds ability to accept POST Data and URL Parameters to shiny (Same-Port Integration). It handles POST requests on a custom path (e.g., /ingress) inside the same ‘shiny’ HTTP server using user interface functions and HTTP responses.
- Exposes latest payload as a reactive and provides helpers for query parameters.
- Normy Description
- Typically, Shiny apps are “pull-based” — they can only get data by actively fetching it (like reading files, querying databases, or calling APIs). But what if you want data to be “pushed” into your Shiny app from external sources? That’s where shinypayload comes in.
- Turns your Shiny app into a data receiver by adding API endpoints to the same server. Instead of your Shiny app having to constantly check “Is there new data?”, external systems can actively send data to your app via HTTP POST requests.
- Features:
- Same-port integration - No need for separate servers or ports
- RESTful API endpoints - Accept POST requests alongside your Shiny UI
- Reactive data streams - POST data automatically becomes reactive values
- Built-in authentication - Token-based security for your endpoints
- Multiple data formats - JSON, form data, query parameters
- Cross-session sharing - Data shared across all connected clients
- Production ready - Comprehensive testing and CRAN-quality code
- Use Cases:
- Real-time Dashboards:
- IoT sensor data streaming
- Live monitoring systems
- Real-time analytics
- e.g. Mobile apps POST survey responses that immediately update your analytics
- API Integration:
- Webhook receivers
- e.g. GitHub sends commit notifications to update your deployment dashboard
- External service integration
- e.g. External monitoring tools POST alerts that instantly appear in your ops dashboard
- Microservice communication
- Webhook receivers
- Mobile/Web Apps:
- React/Vue.js → Shiny data flow
- Progressive web apps
- e.g. Chat/Notifications: External systems send messages that appear in real-time
- Cross-platform integration
- ETL Pipelines:
- Data ingestion endpoints
- Batch processing triggers
- Workflow automation
- Real-time Dashboards:
- Technical Description
Optimization
Misc
- Notes from Video: Vikki Richardson: Optimising Shiny Apps
- Resources
- Offload Shiny’s Workload: COVID-19 processing for the WHO/Europe
- Overview of how they reduced loading times of a World Health Organization app from minutes to seconds
- Shiny docs: caching and async programming
- Chapter 15 of Engineering Production-Grade Shiny Apps covers, in detail, some common performance pitfalls and how to solve them.
- Roofline Modeling
- Offload Shiny’s Workload: COVID-19 processing for the WHO/Europe
Tips
- Reduce the amount of computation occuring inside the app
- caching plots and tables, or by precomputing your data
- Memoise and Pins
- Too many users? (Shiny is single threaded)
- Temporary Fix: Deploy multiple instances of the app
- Queries
- Query Optimization
- Pagination/Lazy Loading
- Benchmark importng data into your app
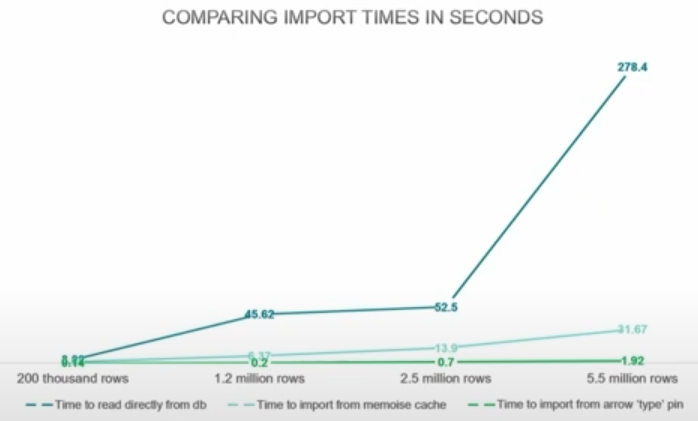
- Analyze whether the app could be using too much reactivity or regenerating UI elements unnecessarily
- Interactive tables and charts can cause the app to lag for large datasets (e.g. 6M rows, 43 fields)
- Vectorization code where possible
- Use columnar file formats (e.g. arrow)
Google Lighthouse
- Misc
- Docs
- Notes from
- Can be used for benchmarking your shiny app in terms of page loading
- Study of Apps from the 2021 Shiny App Contest
- Distribution of values across all metrics
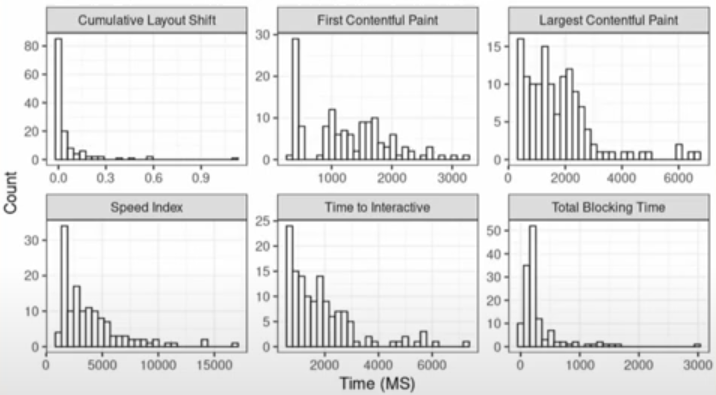
- *Apps with htmlwidgets can have misleading values LCP and FCP metrics*
- i.e. {plotly} chart frames would load before the chart and the metric value would be measured to when the frame loaded
- Scores (n = 134, avg score = 73)
- Good Performance: 40
- Needs Improvement: 74
- Poor: 20
- Distribution of values across all metrics
- Set-Up
- Goto Chrome Dev Tools (i.e. inspect,
ctrl+shift+j) while at your app’s url. On the navbar, click “>>” and you’ll see Lighthouse. Click Analyze Page Load. - Or locally
Install via npm
npm install -g lighthouse lighthouse --output json --output-path path/to/directory file_name.json url- output: json is the file type of the report (csv available too)
- ouput-path: The path where you want the report file
file_name.jsonis the file name- url: The url for your app
- Add flag,
--preset desktop, to benchmark it for a simulated user on a desktop- Default is mobile which simulates a user accessing the app on their phone.
- Goto Chrome Dev Tools (i.e. inspect,
- Metrics
- Scores
Each raw metric value is converted into a metric score from 0 to 100 by looking where the metric value falls on its Lighthouse scoring distribution.
- The scoring distribution is a log-normal distribution derived from the performance metrics of real website performance data on HTTP Archive.
Guidelines (Scores)
90 – 100 Green (Good) 50 – 89 Orange (Needs Improvement) Under 49 Red (Poor)
- First Contentful Paint (FCP) - Measures the time from when the user first navigated to the page to when any part of the page’s content is rendered on the screen. For this metric, “content” refers to text, images, etc.
- Guidelines (Values)
Mobile
0 – 1.8s Green (fast) 1.9 – 3s Orange (moderate) Over 3s Red (slow) Desktop
0 – 0.9s Green (fast) 1.0 – 1.6s Orange (moderate) Over 1.6s Red (slow)
- Guidelines (Values)
- Speed Index (SI) - Measures how quickly content is visually displayed during page load. Lighthouse first captures a video of the page loading in the browser and computes the visual progression between frames. Lighthouse then uses the Speedline Node.js module to generate the Speed Index score
- Guidelines (Values)
Mobile
0 – 3.4s Green (fast) 3.5 – 5.8s Orange (moderate) Over 5.8s Red (slow) Desktop
0 – 1.3s Green (fast) 1.4 – 2.3s Orange (moderate) Over 2.3s Red (slow)
- Guidelines (Values)
- Largest Contentful Paint (LCP) - Measures perceived load speed. It marks the point in the page load timeline when the page’s main content has likely loaded—a fast LCP helps reassure the user that the page is useful.
Guidelines: Desktop and Mobile (Values)
0 – 2.5s Green (good) 2.6 – 4.0s Orange (needs improvement) Over 4.0s Red (poor)
- Total Blocking Time (TBT) - Measures the total amount of time after First Contentful Paint (FCP) where the main thread was blocked for long enough to prevent input responsiveness.
- The main thread is “blocked” when the browser cannot interrupt a task that’s in progress. So in the event that a user does interact with the page in the middle of a long task, the browser must wait for the task to finish before it can respond.
- If the task is long enough (anything higher than 50 milliseconds), it’s likely that the user will notice the delay and perceive the page as sluggish or broken.
- Guideline (Values): Less than 200 milliseconds when tested on average mobile hardware is good.
- Cumulative Layout Shift (CLS) - Measures the largest burst of layout shift scores for every unexpected layout shift that occurs during the entire lifecycle of a page.
A layout shift occurs any time a visible element changes its position from one rendered frame to the next.
A burst of layout shifts, known as a session window, is when one or more individual layout shifts occur in rapid succession with less than 1-second in between each shift and a maximum of 5 seconds for the total window duration.
The largest burst is the session window with the maximum cumulative score of all layout shifts within that window.
Guideline: For mobile and desktop (Values)
0 – 0.1s Green (good) 0.11 – 0.25s Orange (needs improvement) Over 0.25s Red (poor)
- Scores
Deployment
- Misc
- Notes from Slides: Shiny without Boundaries: One App, Multiple Destinations (Balamuta)
- Test with
rsconnect::appDependenciesbefore deploying- Recursively detects all R package dependencies for an application by parsing all .R and .Rmd files and looking for calls to library(), require(), requireNamespace(), ::, and so on.
- It then adds implicit dependencies (i.e. an .Rmd requires Rmarkdown) and adds all recursive dependencies to create a complete manifest of package packages need to be installed to run the app.
- Shinylive
- {shinylive}
- Benefits
- Zero deployment costs
- Reduced maintenance overhead
- Better scalability
- Works offline after initial load
- Considerations
- Limited package support (currently)
- Performance constraints
- Initial load time
- Browser compatibility
- Memory limitations
- Deployment Options
- Github Pages
- Free, GH Actions, Up to 1GB limit
- Quarto Pub
- Free, Publish via
quarto publish - Must use Quarto documents
- Free, Publish via
- Any Static Web Host
- Amazon S3, Netlify, Vercel
- Github Pages
- Best Practices
- Minimize Dependencies
- Each package increases load time
- Consider alternative implementations
- Base size: ~60MB
- Optimize App Size
- Compress data files
- Use efficient data structures
- Test Performance
- Check initial load time
- Monitor memory usage
- Test on various devices
- Minimize Dependencies
- Convert Shiny App to Shinylive App:
shinylive::export(".", "_site")- Tutorial: Deploying an R Shinylive App via GitHub Pages through GitHub Actions
- “.”: Is your shiny app directory (e.g. working directory)
- “_site”: Is the directory for the shinylive app
- View locally:
httpuv::runStaticServer("_site")- Will give an ip address to view the app in your browser.
- Inspecting
- {peeky} - Helps you extract, examine, and run the source code from Shiny applications that have been converted to run in the browser using Shinylive.
- It works with both standalone applications and Quarto documents containing Shinylive components through the quarto-shinylive extension, supporting both R and Python Shiny applications.
- Manually
- Locate the
app.jsonfile- Add to the end of the URL
/app.jsonto download.
- Add to the end of the URL
- Parse JSON structure
- Convert to R list using
jsonlite::fromJSON()
- Convert to R list using
- Extract file contents
- Get the
contentfield for each file
- Get the
- Reconstruct app
- Write to disk or use in R session
- Locate the
- {peeky} - Helps you extract, examine, and run the source code from Shiny applications that have been converted to run in the browser using Shinylive.
- Quarto
Add extension to your project:
quarto add quarto-ext/shinyliveOptions
_quarto.ymlformat: html: resources: - shinylive-sw.js filters: - shinyliveCode Cell
```{shinylive-r}
#| standalone: true
library(shiny)
ui <- fluidPage(...)
server <- function(input, output) {...}
shinyApp(ui, server)
```
Publishing
- Github Pages:
quarto publish gh-pages - Quarto Pub:
quarto publish quarto-pub
- Github Pages:
Github Action (
_quarto.ymlmust be in the repository)Code
on:
  push:
    branches: [main, master]
  release:
      types: [published]
  workflow_dispatch: {}

name: demo-website

jobs:
  demo-website:
    runs-on: ubuntu-latest
    concurrency:
      group: quarto-website-${{ github.event_name != 'pull_request' || github.run_id }}
    permissions:
      contents: read
      pages: write
      id-token: write
    steps:
      - name: "Check out repository"
        uses: actions/checkout@v4

      - name: "Setup pandoc"
        uses: r-lib/actions/setup-pandoc@v2

      - name: "Setup R"
        uses: r-lib/actions/setup-r@v2

      - name: "Setup R dependencies for Quarto's knitr engine"
        uses: r-lib/actions/setup-r-dependencies@v2
        with:
          packages:
            ## Pin version to ensure consistency
            cran::shinylive@0.2.0
            any::knitr
            any::rmarkdown
            any::downlit
            any::xml2

      - name: "Set up Quarto"
        uses: quarto-dev/quarto-actions/setup@v2

      - name: "Render working directory"
        uses: quarto-dev/quarto-actions/render@v2

      - name: Upload Pages artifact
        uses: actions/upload-pages-artifact@v3
        with:
          retention-days: 1

      - name: Deploy to GitHub Pages
        id: deployment
        uses: actions/deploy-pages@v4
- Github Pages
Steps
Create repository structure:
├── .github/workflows/
│   └── build-and-deploy.yml
├── README.md
├── DESCRIPTION
└── app.R
Enable GitHub Pages in repository settings
- Make sure to enable GitHub Pages in the repository settings with Enforce HTTPS checked!
Configure GitHub Actions workflow
Example:
Code
on:
  push:
    branches: [main, master]

name: shinylive-deploy

jobs:
  deploy:
    runs-on: ubuntu-latest
    permissions:
      contents: read
      pages: write
      id-token: write

    steps:
      - uses: actions/checkout@v4
      - uses: r-lib/actions/setup-r@v2
      - name: "Setup R dependency for Shinylive App export"
          uses: r-lib/actions/setup-r-dependencies@v2
          with:
            packages:
              cran::shinylive,
              local::.

      - name: Export app
        run: |
          shinylive::export(".", "_site")
        shell: Rscript {0}

      - name: Upload Pages artifact
        uses: actions/upload-pages-artifact@v3
          with:
            retention-days: 1

      - name: Deploy to GitHub Pages
        id: deployment
        uses: actions/deploy-pages@v4
- shinyelectron
- {shinyelectron} (Video)(Windows 11)
- Converts Shiny web applications into standalone desktop applications for using Electron.
- Combines Chromium (rendering) and Node.js (backend)
- Considerations
- Larger application size
- OS specific builds
- Distribution updating
- Increased complexity
- Performance
- AWS
- Notes from
- Features
- Secure, end-to-end encrypted (SSL, TLS) access to dashboards.
- Secure authentication through E-mail and Single-Sign-On (SSO).
- Horizontal scalability of dashboards according to usage, fail-safe.
- Easy adaptability by analysts through automation and continuous integration (CI/CD).
- Easy maintenance and extensibility for system operators.
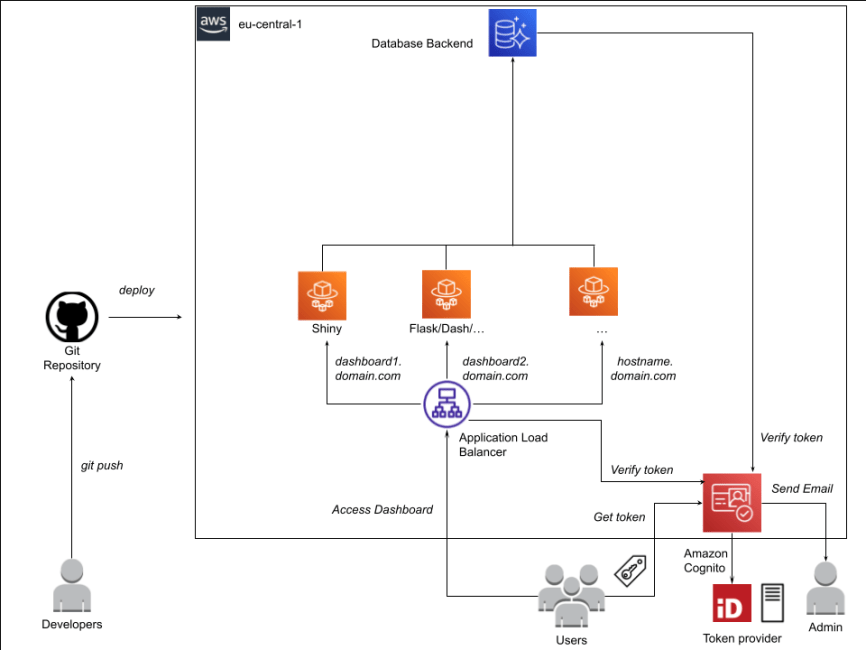
- Components
- Application Load Balancer (ALB) to handle secure end-to-end (SSL) encrypted access to the dashboards based on different host names (host-based-routing).
- AWS Cognito for user authentication based on E-mail and SSO through Ping Federate.
- AWS Fargate for horizontal scalability, fail-safe operations and easy maintenance.
- AWS Codepipeline and Codebuild for automated build of dashboard Docker containers.
- Extensive usage of managed services requiring low maintenance (Fargate, Cognito, ALB) and Amazon Cloud Development Kit (CDK) to define and manage infrastructure-as-code managed in Git and deployed via Code Pipelines.
Security
Misc
- Also see Docker >> Security
- Packages
- {backendlessr} - Maintain users base (registration, login, logout, user profiles) and other operations (counters, data tables storage) through Backendless platform. Backendless Cloud services are free of charge for up to 60 calls per minute.
- {firebase} - Create mechanisms to authenticate Shiny users. It does so by wrapping the Firebase interface by Google. Also has an S3-like storage feature.
- {firebase.auth.rest} - Suitable if you need absolute full control on how you build & customize your login & registration process/pages, while still using Firebase Auth.
- {login}
- Provides tools for users to create their own accounts and reset passwords. This is particularly useful for Shiny applications used to collect data without a pre-existing user management system.
- User credentials are stored in any database that supports the DBI interface.
- For an extra layer of security, you can salt the password before storing it in the database. (Also see Apache, Spark >> Errors >> Data Skew)
- Passwords are hashed using MD5 in the browser so that unencrypted passwords are never available to the Shiny server.
- {rAccess} - Provides a flexible framework for implementing hierarchical access control in ‘shiny’ applications.
- Support for multiple storage backends (local, ‘AWS S3’, ‘Posit Connect’)
- Enables fine-grained control over application features, with built-in audit trails and user management capabilities.
- Integrates seamlessly with ’Posit Connect’s authentication system
- {shinyauthr}
- For user authentication. App doesn’t get rendered until user is authenticated
- Allows for cookies and password hashing
- {shinymanager}
- Simple and secure authentication mechanism for single ‘Shiny’ applications.
- Credentials can be stored in an encrypted ‘SQLite’ database or on your own SQL Database (Postgres, MySQL, …).
- Source code of main application is protected until authentication is successful.
- Multiple languages available
- Apps hosted on a server without an SSL certificate could be open to interception of user names and passwords submitted by a user.
- Both RStudio’s commercial shiny hosting options or shinyproxy have built in authentication options
- Industry Compliance Requirements
- Healthcare: HIPAA
- Education: FERPA
- Finance: PCI DSS
- Government: FedRAMP
{backendlessr}
remotes::install_gitlab("rresults/backendlessr")- Provides user registration, login, logout, profiles
- Some small amounts of data can be sent to backendless (not log files)
- There are some user counting functions in the package for keeping track of API calls (I think)
- Some small amounts of data can be sent to backendless (not log files)
- API wrapper for backendless platform
- Free for up to 60 API calls per minute 1M API calls per month
- If you need more, use invite code p6tvk3 when you create a new app to get 25% off for the first 6 months
- Demo login:
backendlessr::shiny_demo_login(http://0.0.0.0:3838)
.png)
- Clicking the “Register” button calls the backendless API
- Displays “Successful” if user registration worked
- Steps
Register at backendless and get a free account
Register you app
.png)
- Get the Application ID and API key
Add ID and key to .Renviron (for testing)
BACKENDLESS_APPID = "<app id>"
BACKENDLESS_KEY = "<api_key>"
Add ID and key to Docker Swarm secrets (for production)
Install package and run functions in your shiny app
ExampleBasic
ui <- fluidPage( titlePanel("User access demo"), actionLink("open login", "Log in"), hidden(actionLink("logout", "Log out")), hidden(moduleLoginUserUI("loginmain")), hidden(plotOutput("demoPlot", height = "300px")) #... ) server <- function(input, output, session) { # ... ObserveEvent( input$open_login, {showElement("loginmain-login-form")} #... ) }- App listens for
actionLinkopen_login which is the user login into the app - Then
showElementunhides all the hidden things in the ui (e.g. logout, loginmain module, demoPlot) andactionLinkLog in becomes hidden (I think)
- App listens for
- Bunch of user credential functions available but here’s a list that currently aren’t:
- Social Network logins (e.g. to allow a user to use their Facebook account to log in to our service);
- Async calls;
- Geolocation;
- Logging (send log messages of your app to Backendless platform).
- Enhanced Security
- User password reset