Knowledge Graphs
Misc
- Notes from:
- Tools
- kgl - Knowledge Graph Query Language
- Interface and sytax to query knowledge graph data
- kgl - Knowledge Graph Query Language
- Use Cases
- Calculate the centralities for any node, to understand how important a concept (node) is to the body of work
- Analyze connected and disconnected sets of concepts, or calculate communities of concepts for a deep understanding of the subject matter.
- Used to implement Graph Retrieval Augmented Generation (GRAG or GAG). Can give much better results than RAG when querying an LLM about documents.
- Retrieving the context that is the most relevant for the query with a simple semantic similarity search is not always effective. Especially, when the query does not provide enough context about its true intent, or when the context is fragments across a large corpus of text.
- Retail: Knowledge graphs have been for up-sell and cross-sell strategies, recommending products based on individual purchase behavior and popular purchase trends across demographic groups.
- Entertainment: Knowledge graphs are also leveraged for artificial intelligence (AI) based recommendation engines for content platforms, like Netflix, SEO, or social media. Based on click and other online engagement behaviors, these providers recommend new content for users to read or watch.
- Finance: This technology has also been used for know-your-customer (KYC) and anti-money laundering initiatives within the finance industry. They assist in financial crime prevention and investigation, allowing banking institutions to understand the flow of money across their clientele and identify noncompliant customers.
- Healthcare: Knowledge graphs are also benefiting the healthcare industry by organizing and categorizing relationships within medical research. This information assists providers by validating diagnoses and identifying treatment plans based on individual needs.
Terms
Knowledge Graph - Also known as a semantic network, represents a network of real-world entities — i.e. objects, events, situations, or concepts — and illustrates the relationship between them. Each node represents a concept and each edge is a relationship between a pair of such concepts. This information is usually stored in a graph database and visualized as a graph structure, prompting the term knowledge “graph.”
Process
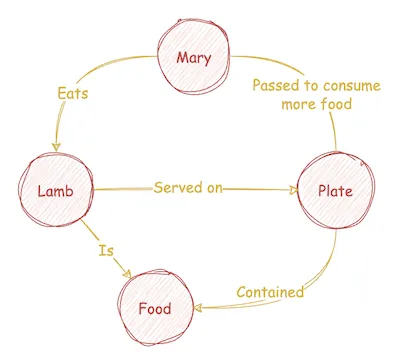
- Corpus Example:
Mary had a little lamb,
You’ve heard this tale before;
But did you know she passed her plate,
And had a little more! - Steps
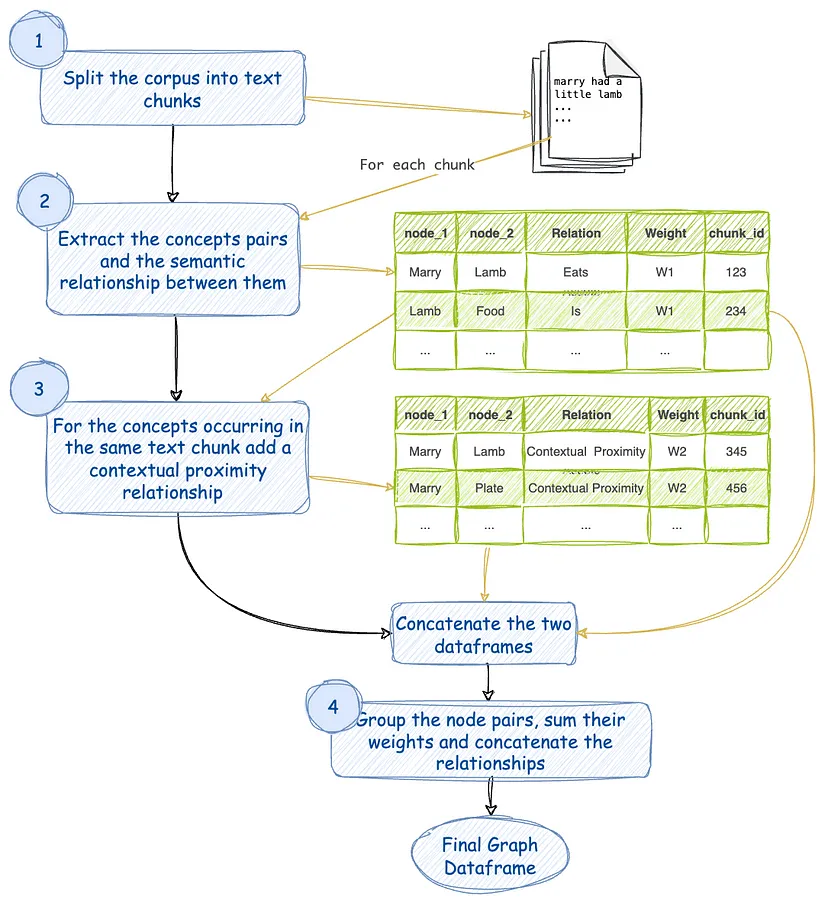
- Split the corpus of text into chunks. Assign a chunk_id to each of these chunks.
- For every text chunk, extract concepts and their semantic relationships using a LLM. This relation is assigned a weight of W1. There can be multiple relationships between the same pair of concepts. Every such relation is an edge between a pair of concepts.
- Consider that the concepts that occur in the same text chunk are also related by their contextual proximity. This relation is assigned a weight of W2. Note that the same pair of concepts may occur in multiple chunks.
- Group similar pairs, sum their weights, and concatenate their relationships. So now we have only one edge between any distinct pair of concepts. The edge has a certain weight and a list of relations as its name.
- Populate nodes (concepts) and edges (relations) in a graph data structure or a graph database.
- Visualize