Modules
Misc
- Resources
- RStudio
- Mastering Shiny, Ch. 19
- Engineering Production-Grade Shiny Apps - {golem} book
- Simple app packaged, modules, etc.
- Packages
- {golem} - also has many example apps and resources
- {rhino} - appsilon package
- {shinydataviewer} - A reusable Shiny module for viewing tabular data with a searchable table and a variable summary sidebar inspired by the Positron data explorer
- Differences between monolith apps and using modules
- Functions: the
uiandserverare both written as functions. - Id: id is the first argument in the module function. The unique id tells the server function call which ui function call.
- Namespace: Input IDs from different modules can have the same name, because they’re associated with the unique id for their specific module. This can be useful if multiple people are creating modules for the app. (The has to do with usage of
NS)
- Functions: the
- When to use modules (source)
- Calling the same component creating function multiple times.
- Creating a list of
idvalues and iterating over and calling a function that makes a component. - Creating at least 2 lists that track the
idand some other input for the component.- For example a separate list for the
idorlabel, but can also include things like a column name of a dataframe.
- For example a separate list for the
- Iterating across lists(s) to ensure inputs are captured together
- Especially if you find your self using the
zip()function
- Especially if you find your self using the
Workflow
Decompose Requirements to help determine modules
- Pick a subset of the data
- The metrics of interest are:
- e.g. average departure delay, average arrival delay, proportion of flights with an arrival delay > 5min
- For each metric of interest, users should:
- Example:
- See a time series plot of the average daily value of the metric
- Be able to click a download button to download a PNG of the plot
- Read a text summary that reports the number of days with breaches
- Example:
Demo function for testing modules
module_demo <- function () { # define test data df <- data.frame(x = 1:30, y = 1:30) # call module components ui <- fluidPage(module_ui("x")) server <- function(input, output, session) { module_server("x", reactive({df})) } shinyApp(ui, server) }- When testing modules, use
source("./modules/my-module.R")to load the module.
- When testing modules, use
Example:
Handle one project requirement at a time
Build the module for text summary of a metric
text_ui <- function(id) {

  fluidRow(textOutput(NS(id, "text")))

}

text_server <- function(id, df, vbl, threshhold) {

  moduleServer(id, function(input, output, session) {

    n <- reactive({sum(df()[[vbl]] > threshhold)})

    output$text <- renderText({
      paste("In this month",
            vbl,
            "exceeded the average daily threshhold of",
            threshhold,
            "a total of", n(), "days")
    })
  })
}

text_demo <- function() {
  df <- data.frame(day = 1:30, arr_delay = 1:30)
  ui <- fluidPage(text_ui("x"))
  server <- function(input, output, session) {
    text_server("x", reactive({df}), "arr_delay", 15)
  }
  shinyApp(ui, server)
}
Build the module for plotting
plot_ui <- function(id) {

  fluidRow(
    column(11, plotOutput(NS(id, "plot"))),
    column( 1, downloadButton(NS(id, "dnld"), label = ""))
)

}

plot_server <- function(id, df, vbl, threshhold = NULL) {

  moduleServer(id, function(input, output, session) {
    plot <- reactive({viz_monthly(df(), vbl, threshhold)})
    output$plot <- renderPlot({plot()})
    output$dnld <- downloadHandler(
      filename = function() {paste0(vbl, '.png')},
      content = function(file) {ggsave(file, plot())}
    )
  })

}

plot_demo <- function() {
    df <- data.frame(day = 1:30, arr_delay = 1:30)
    ui <- fluidPage(plot_ui("x"))
    server <- function(input, output, session) {
        plot_server("x", reactive({df}), "arr_delay")
    }
    shinyApp(ui, server)
}
Compose both modules
metric_ui <- function(id) {

    fluidRow(
      text_ui(NS(id, "metric")),
      plot_ui(NS(id, "metric"))
    )

}

metric_server <- function(id, df, vbl, threshhold) {

    moduleServer(id, function(input, output, session) {
      text_server("metric", df, vbl, threshhold)
      plot_server("metric", df, vbl, threshhold)
    })

}

metric_demo <- function() {

    df <- data.frame(day = 1:30, arr_delay = 1:30)
    ui <- fluidPage(metric_ui("x"))
    server <- function(input, output, session) {
    metric_server("x", reactive({df}), "arr_delay", 15)
    }
    shinyApp(ui, server)

}
Build-out app
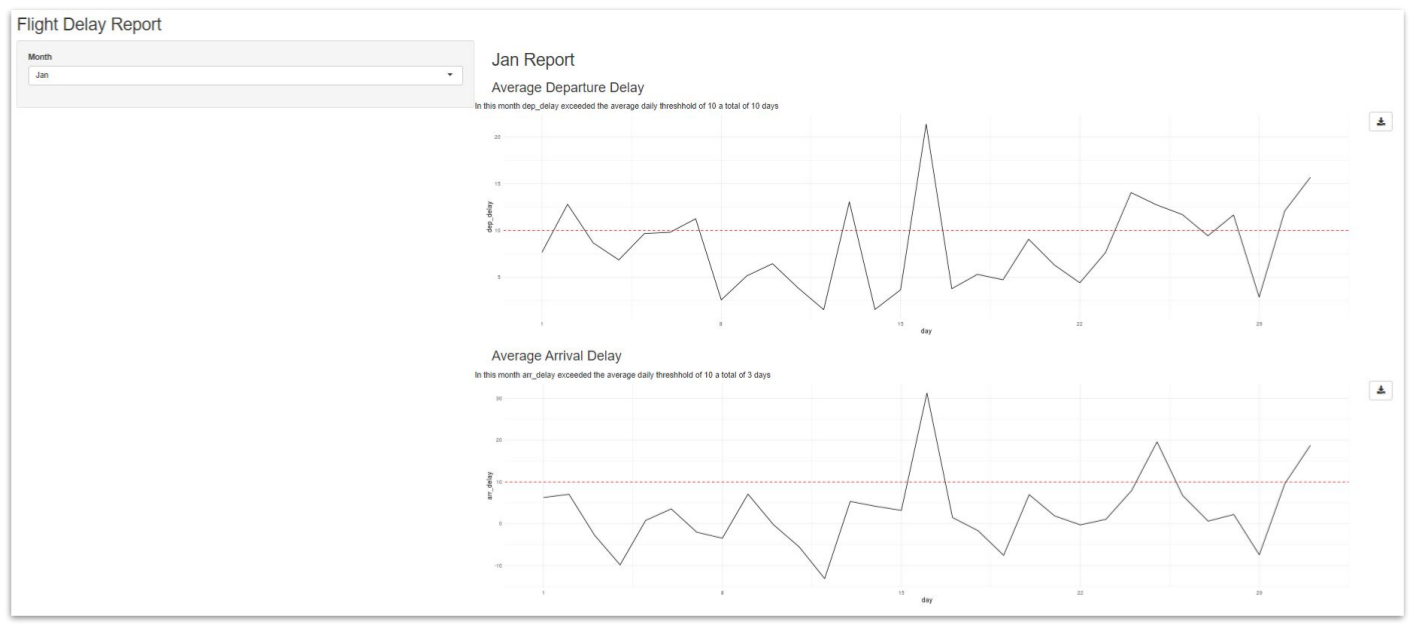
ui <- fluidPage(

    titlePanel("Flight Delay Report"),

    sidebarLayout(
      sidebarPanel = sidebarPanel(
        selectInput("month", "Month",
        choices = setNames(1:12, month.abb),
        selected = 1
      )
    ),
    mainPanel = mainPanel(
      h2(textOutput("title")),
      h3("Average Departure Delay"),
      metric_ui("dep_delay"),
      h3("Average Arrival Delay"),
      metric_ui("arr_delay"),
      h3("Proportion Flights with >5 Min Arrival Delay"),
      metric_ui("ind_arr_delay")
    )
)
server <- function(input, output, session) {

    output$title <- renderText({paste(month.abb[as.integer(input$month)], "Report")})
    df_month <- reactive({filter(ua_data, month == input$month)})
    metric_server("dep_delay", df_month, vbl = "dep_delay", threshhold = 10)
    metric_server("arr_delay", df_month, vbl = "arr_delay", threshhold = 10)
    metric_server("ind_arr_delay", df_month, vbl = "ind_arr_delay", threshhold = 0.5)

}
Best Practices
There shouldn’t be any deeply nested bracketing in your code
Pass reactive variable to modules. Don’t call modules inside of some other reactive statement like observe()
Example: Bad module calling
observe({ # Process data before sending it into the module if (input$filterTo != "special") { myModuleServer( data %>% filter(val == input$filterTo) ) } else { # Handle special case myModuleServer( data %>% ... ) } })Example: Good module calling
server <- function(input, output, session
  # initialise the app state...
  app_state <- reactiveValues(.
  .
  # add server logic
  mod_commute_mode("mode", app_state)
  mod_commute_map("map", app_state)
  mod_commute_table("table", app_state)
  mod_commute_filter("filter", app_state)
}
Liberally use reactive variables and your code becomes much cleaner, faster, and more maintainable
datasheet_df <- reactive({ sample_data %>% filter(site %in% input$selectSiteDatasheets) %>% ... }) # Download button output$download_datasheet <- downloadHandler( filename = function() { paste("spreadsheet_", input$selectSiteDatasheets, ".csv", sep = "") }, content = function(file) { write.csv(datasheet_df(), file, row.names = FALSE) } )- Here datasheet_df is a reactive variable that Shiny will always keep up to date. Therefore the download button only needs to describe that it uses whatever the current value of that reactive is.
- This separation keeps the code easy to reason about and allows easy use of datasheet_df in other contexts than just the download button.
- Here datasheet_df is a reactive variable that Shiny will always keep up to date. Therefore the download button only needs to describe that it uses whatever the current value of that reactive is.