Dashboards
Misc
- Packages
- {summarywidget} - Works with Crosstalk to display a single summary statistic. The statistic updates when the Crosstalk selection changes.
- A SummaryWidget can display the count, sum or mean of one column of selected data. It can also have a fixed filter that selects a subset of the full dataset.
- {kpiwidget} - Works with crosstalk to display key performance indicators (KPIs) in Quarto dashboards. Extends {summarywidget}
- Offers “count”, “distinctCount”, “duplicates”, “sum”, “mean”, “min”, “max” as well as comparison modes (“ratio” and “share”) that let you compare groups within your data.
- {summarywidget} - Works with Crosstalk to display a single summary statistic. The statistic updates when the Crosstalk selection changes.
- Resources
- Notes from Velasquez talk
- Both interactive JavaScript-based plots and standard raster based plots are supported.
- Deployment Types
- Static: Rendered a single time (e.g.when underlying data won’t ever change)
- Scheduled: Rendered on a schedule (e.g. via cron job) to accommodate changing data.
- Parameterized: Variations of static or scheduled dashboards based on parameters.
- Interactive: Fully interactive dashboard using Shiny (requires a server for deployment).
- See Shiny, Hosting
- Loading Shiny Server Modules
Modules need loaded into a context: setup chunk
Example: (source)
```{r}
#| context: setup
#| include: false

# load all server functions from the R folder
for (file in list.files("R", full.names = TRUE)) {
  source(file)
}
```

```{r}
#| context: server

gpx <- gpx_upload_server("gpx_upload")
# etc
```
YAML
Basic
---
title: "My first Quarto dashboard"
format: dashboard
---
Logo and Nav-Buttons
---
title: "My first Quarto dashboard"
format:
  dashboard:
    logo: images/car.png
    nav-buttons:
      - reddit
      - icon: gitlab
        href: https://gitlab.com/ivelasq
---
Add Shiny Interactivity
---
title: "My first Quarto dashboard"
format:
  dashboard:
    orientation: rows
server: shiny
---
Bootswatch Themes
---
title: "My first Quarto dashboard"
format:
  dashboard:
    theme: united
server: shiny
---
CSS and SCSS files
---
title: "My first Quarto dashboard"
format:
  dashboard:
    theme: style.scss
server: shiny
---
Layouts
Using the YAML: Rows or Columns
--- title: "My first Quarto dashboard" format: dashboard: orientation: rows --- ```{r} #| title: "Plot 1" plot(mtcars) ``` ```{r} #| title: "Plot 2" plot(mtcars) ```- orientation: columns for columns format
Using Headings: Multiple Rows
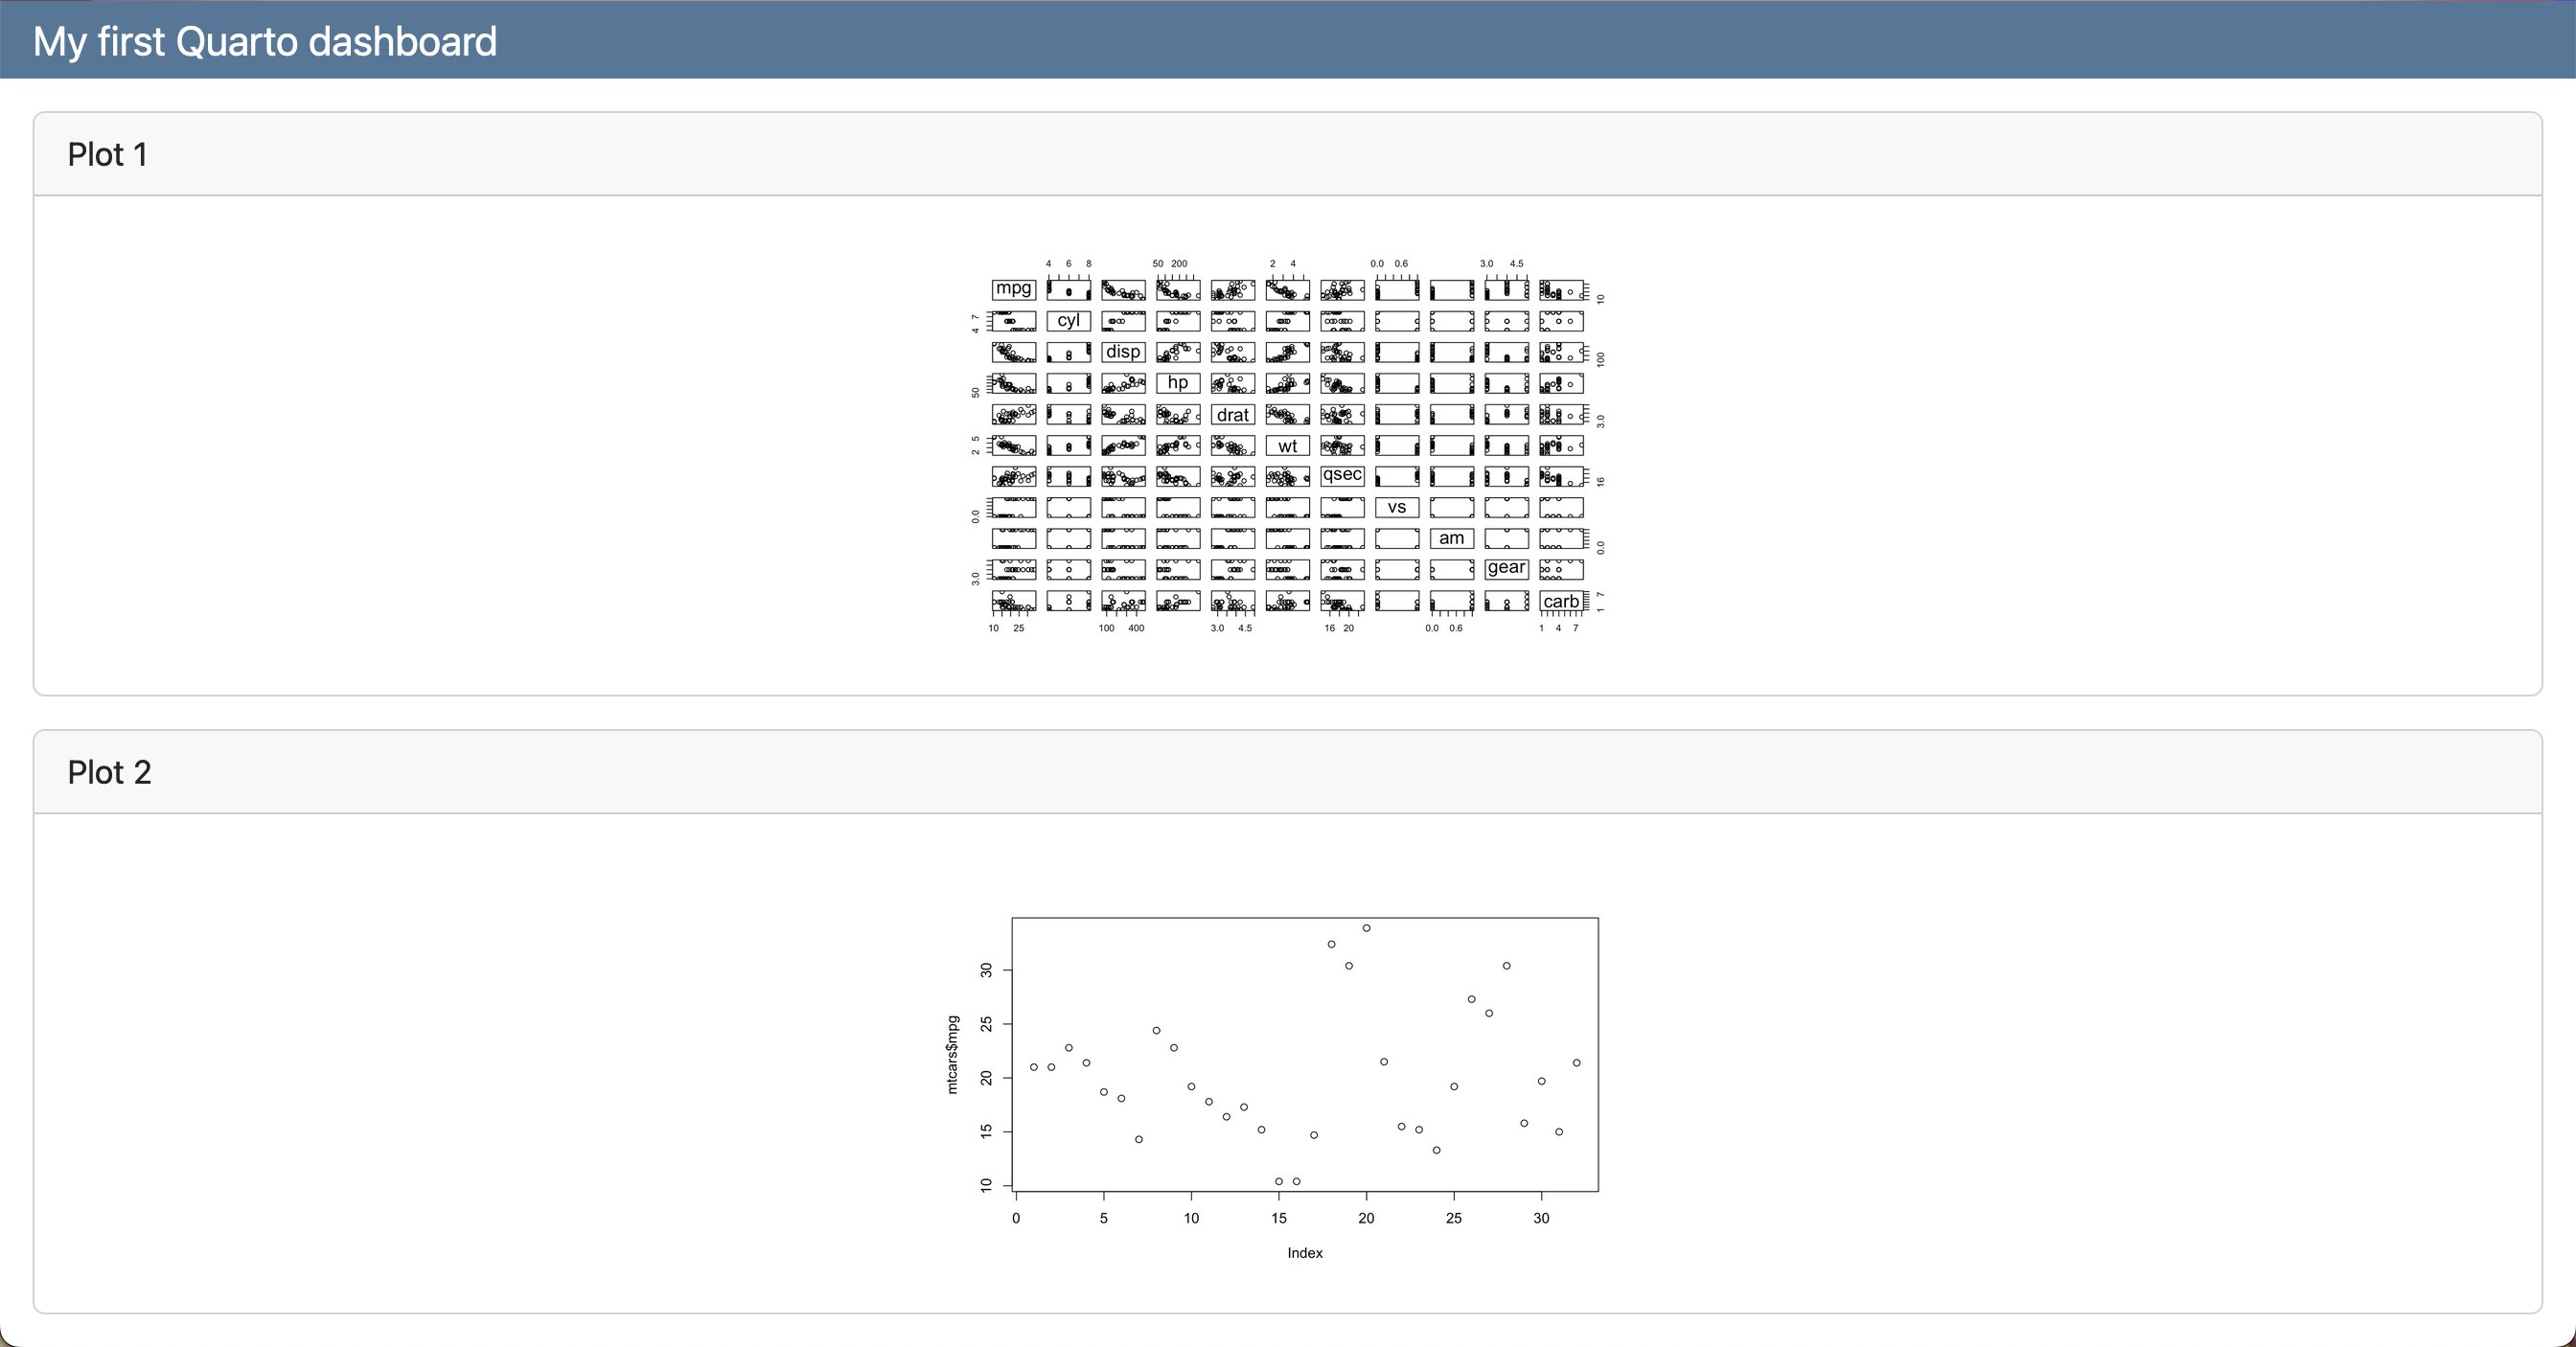
---
title: "My first Quarto dashboard"
format: dashboard
---

## Row

Here is my dashboard:

## Row

```{r}
#| title: "Plot 1"
plot(mtcars)
```

```{r}
#| title: "Plot 2"
plot(mtcars$mpg)
```
Using Headings: Rows and Columns
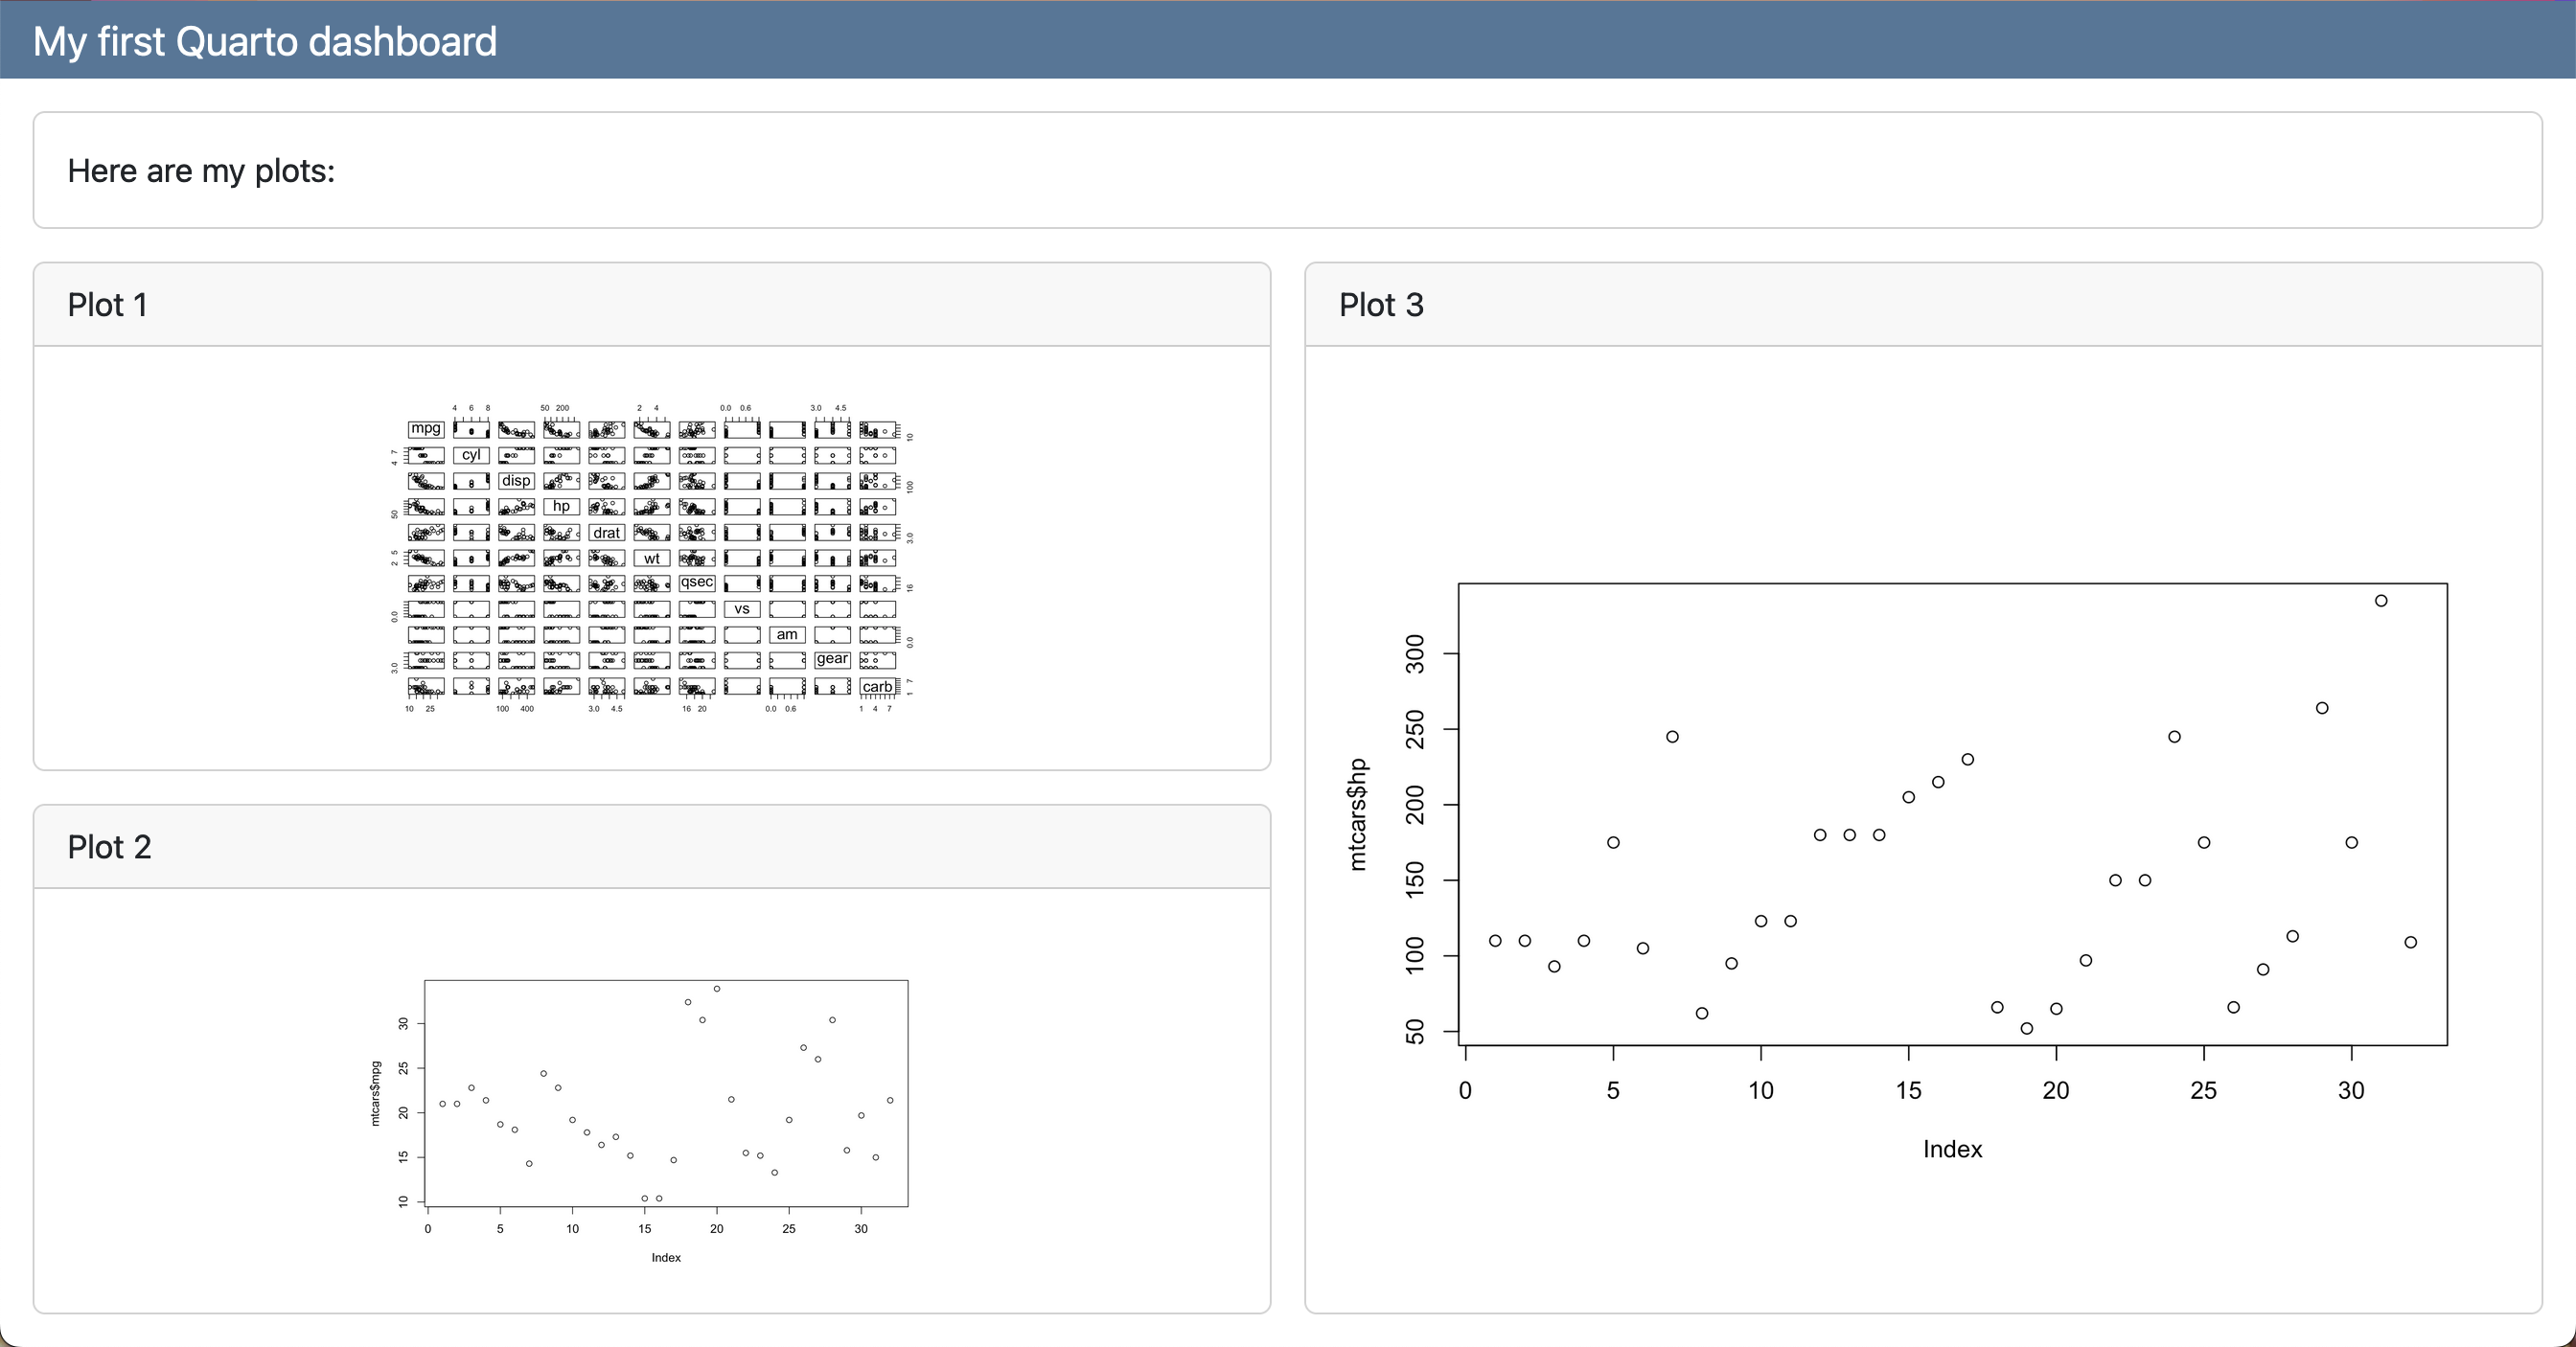
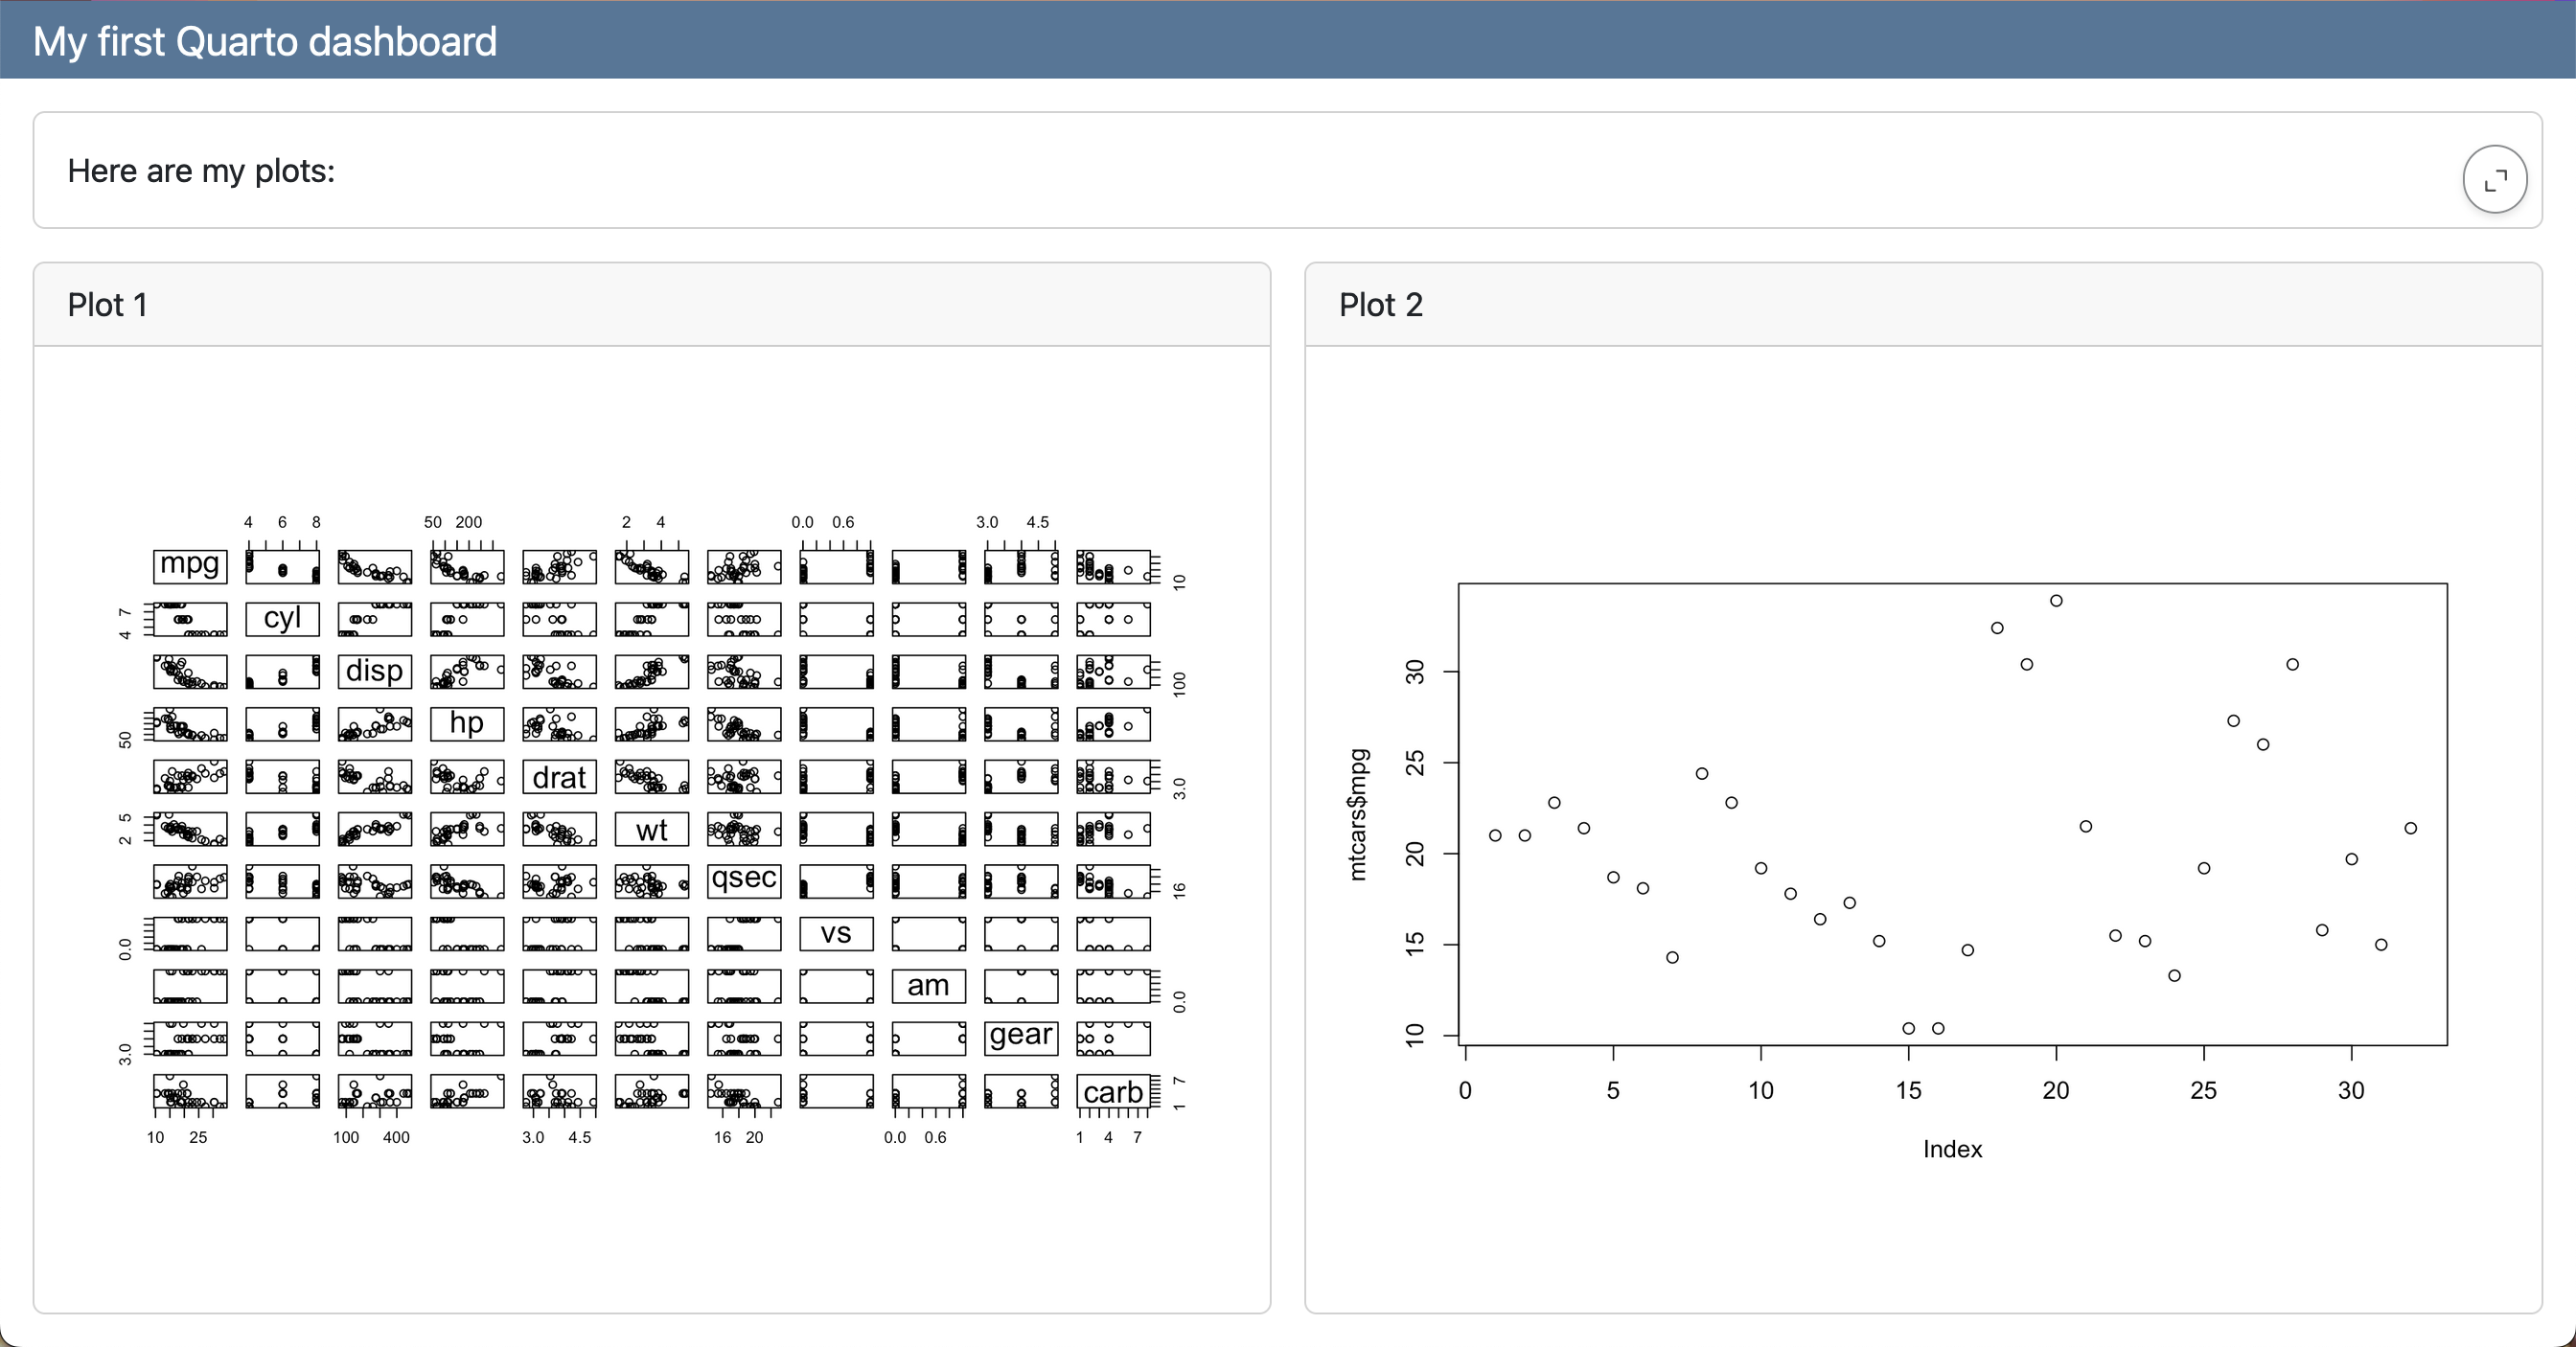
--- title: "My first Quarto dashboard" format: dashboard --- ## Row Here is my dashboard: ## Row ### Column ```{r} #| title: "Plot 1" plot(mtcars) ``` ```{r} #| title: "Plot 2" plot(mtcars) ``` ### Column ```{r} #| title: "Plot 3" plot(mtcars) ```- 2 rows where the second row has 2 columns and the 1st column has 2 plots
- Sub-layouts determined by h2 and h3 headers
Tabsets
### Column {.tabset}

```{r}
#| title: "Plot 1"
plot(mtcars)
```

```{r}
#| title: "Plot 2"
plot(mtcars$mpg)
```
Pages
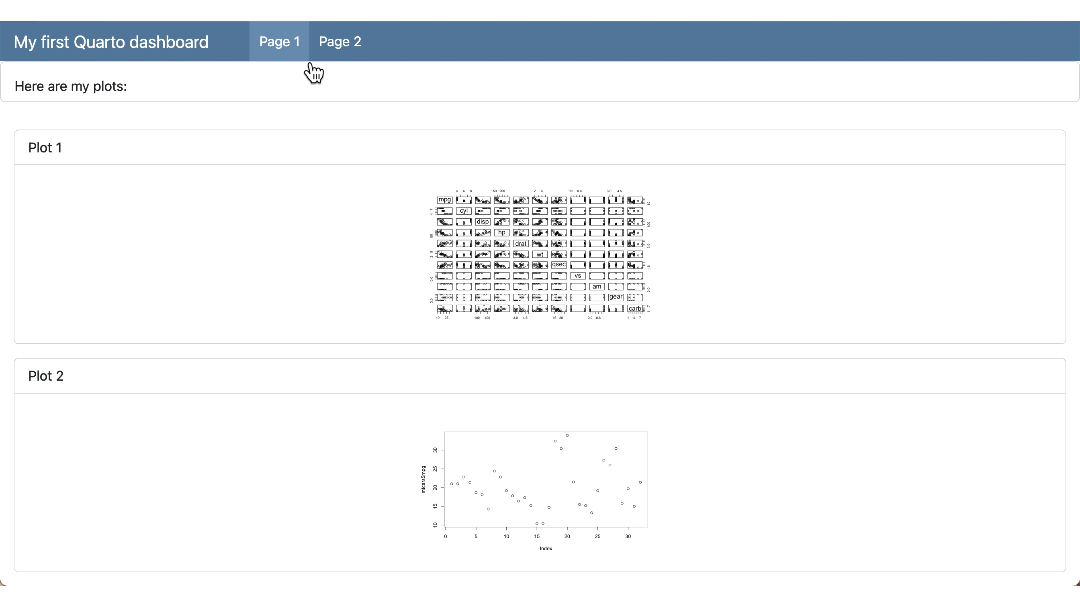
--- title: "My first Quarto dashboard" format: dashboard --- ## Row Here is my dashboard: # Page 1 ```{r} #| title: "Plot 1" plot(mtcars) ``` ```{r} #| title: "Plot 2" plot(mtcars$mpg) ``` # Page 2 ```{r} #| title: "Plot 3" plot(mtcars$hp) ```- Pages syntax uses h1 headers
- h2 row specification at the top means that row is present in both pages
Text
Only-Text
::: {.card}
This text will be displayed within a card
:::
With Cell
::: {.card}
```{r}
plot(mtcars)
```

Above is my plot.
:::
Value Boxes
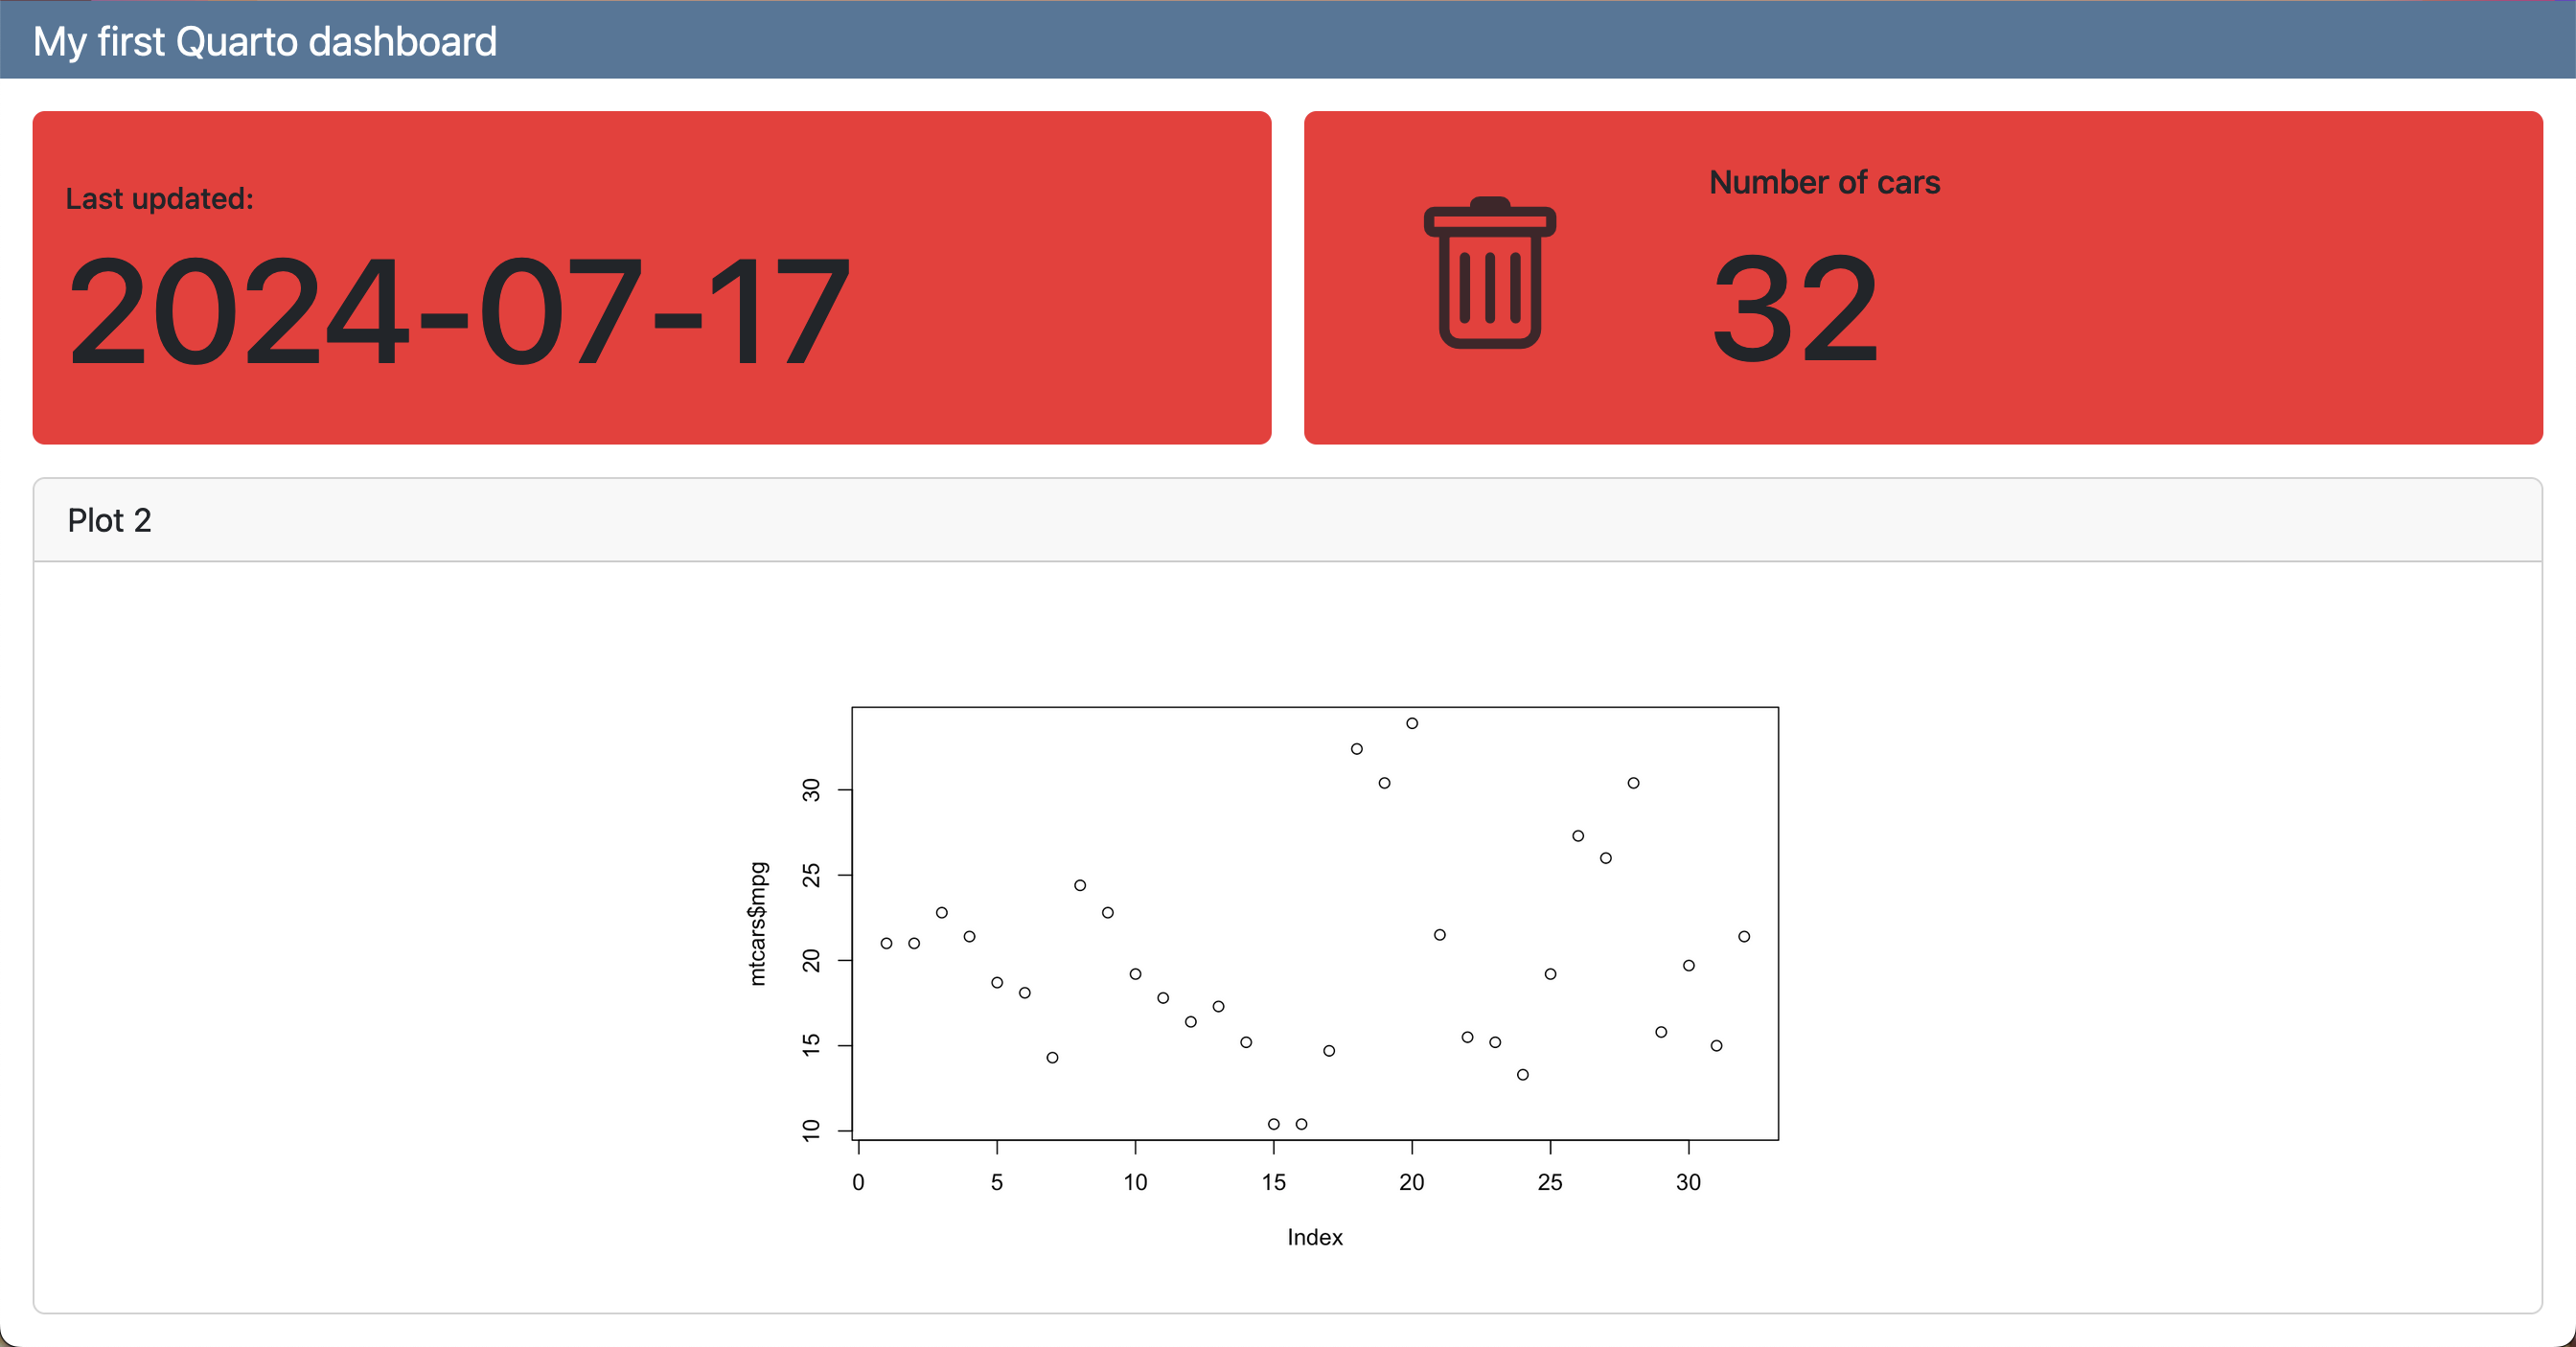
## Row

::: {.valuebox color="#F52A32"}
Last updated:

`{{r}} Sys.Date()`
:::

```{r}
#| content: valuebox
#| title: "Spam per day"
n <- mtcars |> tibble::as_tibble() |> dplyr::count() |> dplyr::pull(n)

list(
  icon = "trash",
  color = "#F52A32",
  value = n
)
```
Inputs
Sidebar
## {.sidebar}

Sidebar text here!
Add Shiny interactivity
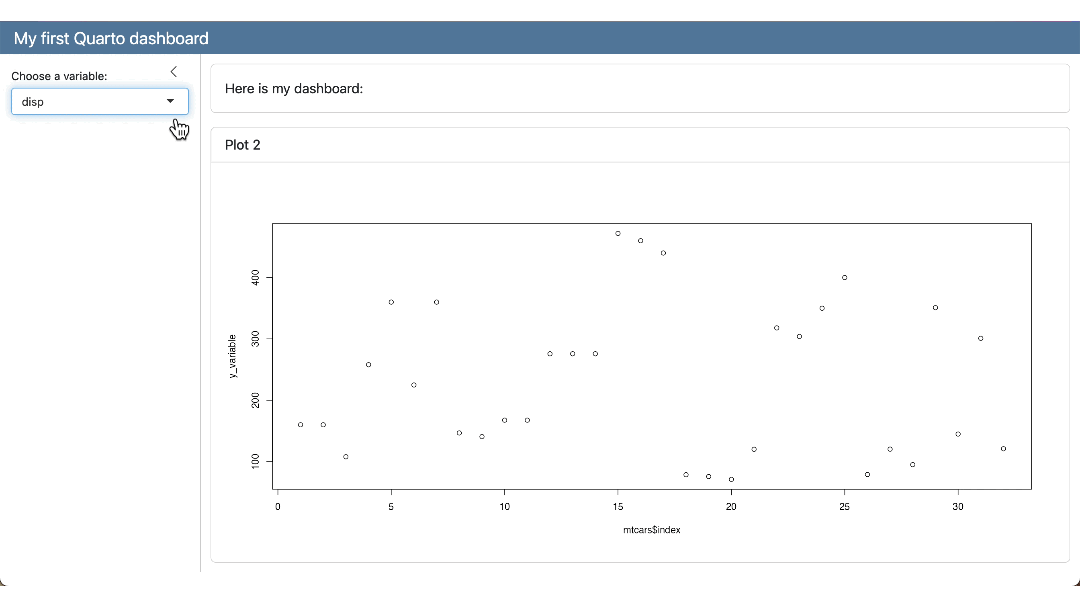
```{r} #| context: setup library(ggplot2) ``` ## {.sidebar} ```{r} selectInput( "variableChoice", "Choose a variable:", choices = names(mtcars) ) ``` ## Column ### Row Here is my dashboard: ### Row ```{r} #| title: "Plot 2" plotOutput("variablePlot") ``` ```{r} #| context: server output$variablePlot <- renderPlot({ yVar <- mtcars[[input$variableChoice]] plot(mtcars$index, yVar) }) ``` ```- Need server: shiny in the YAML (See YAML section)