Optimization
Misc
- Packages
- CRAN Task View
- {nleqslv} - Solve systems of nonlinear equations using a Broyden or a Newton method with a choice of global strategies such as line search and trust region
- {nloptr} - Solves nonlinear optimization problems using NLopt.
- NLopt is a free/open-source library for nonlinear optimization, providing a common interface for a number of different free optimization routines available online as well as original implementations of various other algorithms
- Available algorithms
- {Uno} (Unifying Nonlinear Optimization) - A C++ solver for nonlinearly constrained optimization, via Uno’s C API
- Resources
Solvers
- Base R
solve- The default method is an interface to the LAPACK routines DGESV and ZGESV. LAPACK is from https://netlib.org/lapack/.Example
\[\begin{align} 3x + 2y - z &= 7\\ x - y + 2z &= -1\\ 2x + 3y + 4z &= 12 \end{align}\]
a <-
  matrix(c(3, 2, -1, 1, -1, 2, 2, 3, 4),
         nrow = 3,
         byrow = TRUE)
b <- c(7, -1, 12)
solve(a, b)
#> [1] 0.6571429 2.8000000 0.5714286
- Open Source
- See packages in bookmarks
- CBC
- Google OR Tools
- Commercial
- XPress, CPLEX
- Gurobi
- For a DoorDash’s vehicle routing problem, Gurobi was 34 times faster on average than CBC
- Pros
- Scalability of the solvers, ease of abstracting feasible solutions when optimality is hard, ability to tune for different formations, relatively easy API integration to Python and Scala, flexibility of the prototype and deployment licensing terms from the vendors, and professional support.
Bipartite Matching Problem
- A bipartite graph has 2 sets of vertices (e.g. Dashers and Merchants) and the edges (ETA to merchants) only travel between boths sets (Dashers and Merchants) and not within the sets (e.g. Dasher to Dasher).
- Solution: Hungarian Algorithm and a lecture (15 min)
- Example: Optimally assign Dashers to Merchants
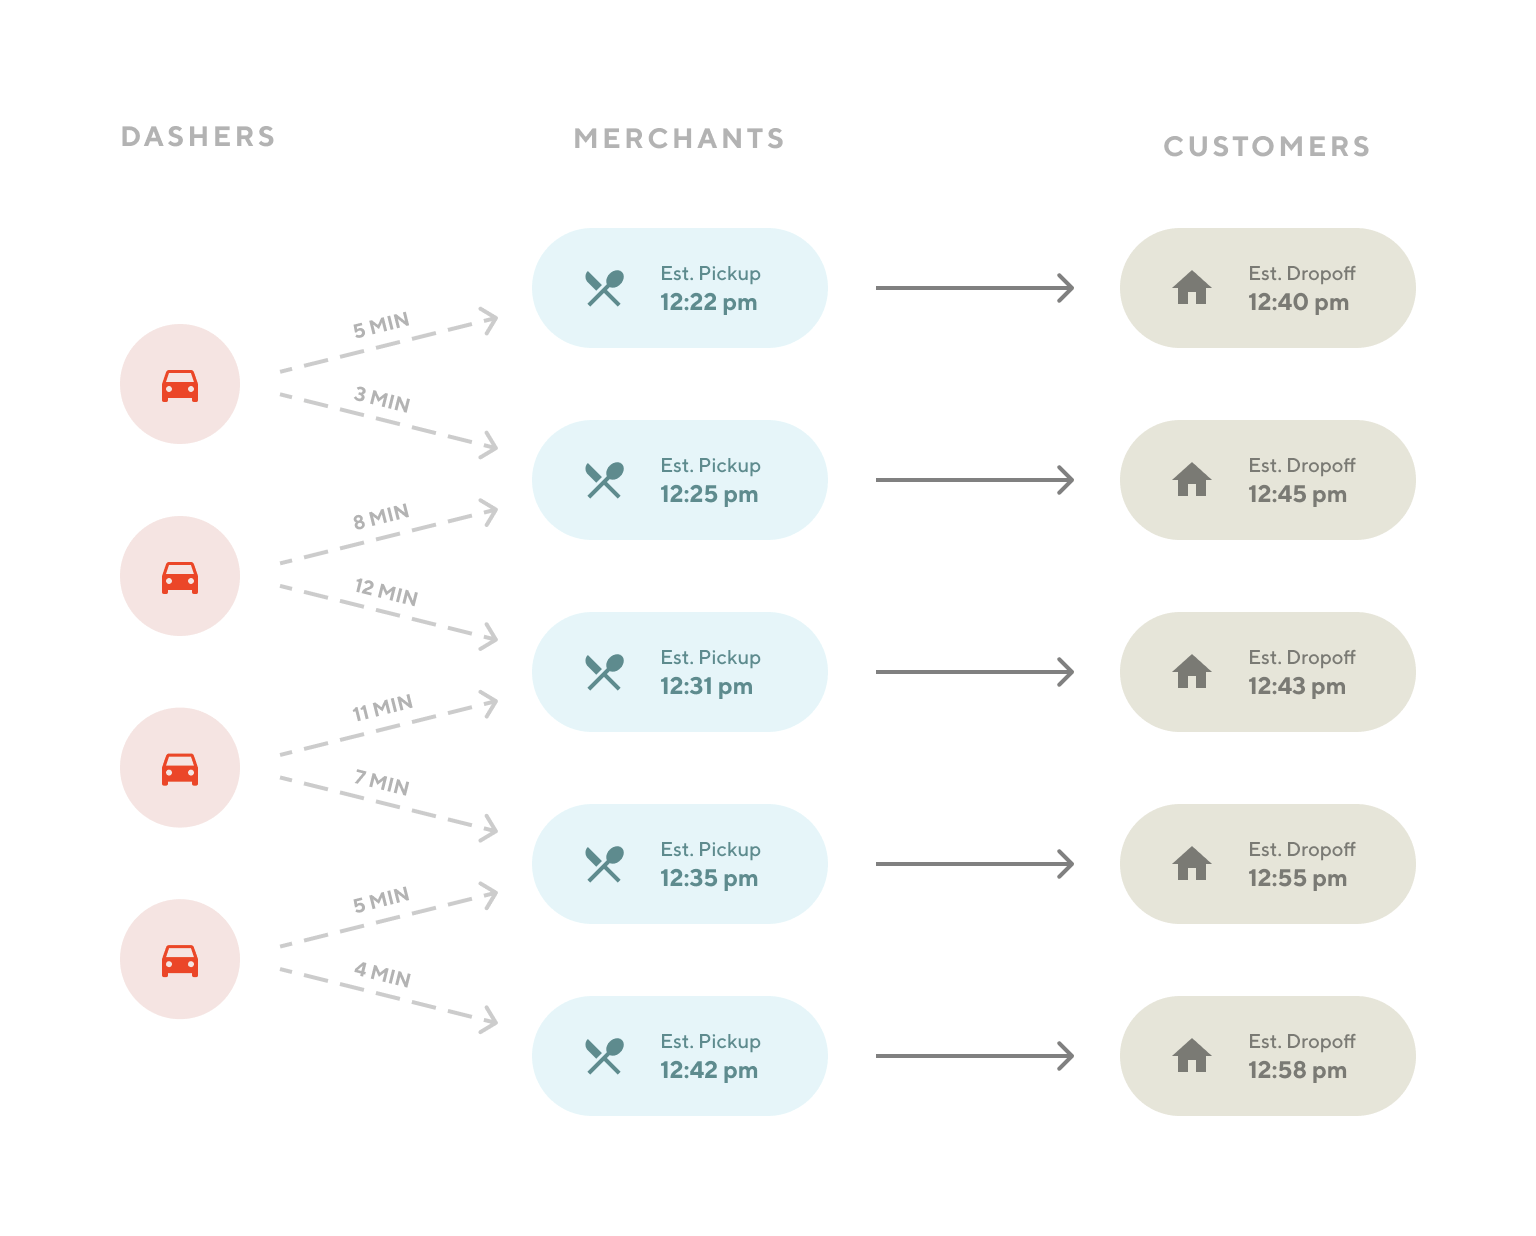
- Shows DoorDash delivery persons (Dashers) with ETA times to merchants, estimated food pick-up times from merchants, estimated customer drop-off times
- Issues:
- Runtime of large instances is excessive for a real-time dynamic system (polynomial time)
- Doesn’t support more complicated routes with 2 or more tasks
- Example shows 5 merchants and only 4 Dashers, so at least one Dasher needs to travel to 2 Merchants
Vehicle Routing Problem
https://en.wikipedia.org/wiki/Vehicle_routing_problem
- Allows multiple deliveries in a route
Example: Optimizing Deliverers (Dashers) with food orders (Merchant/Customers) (See example in bipartite matching section)
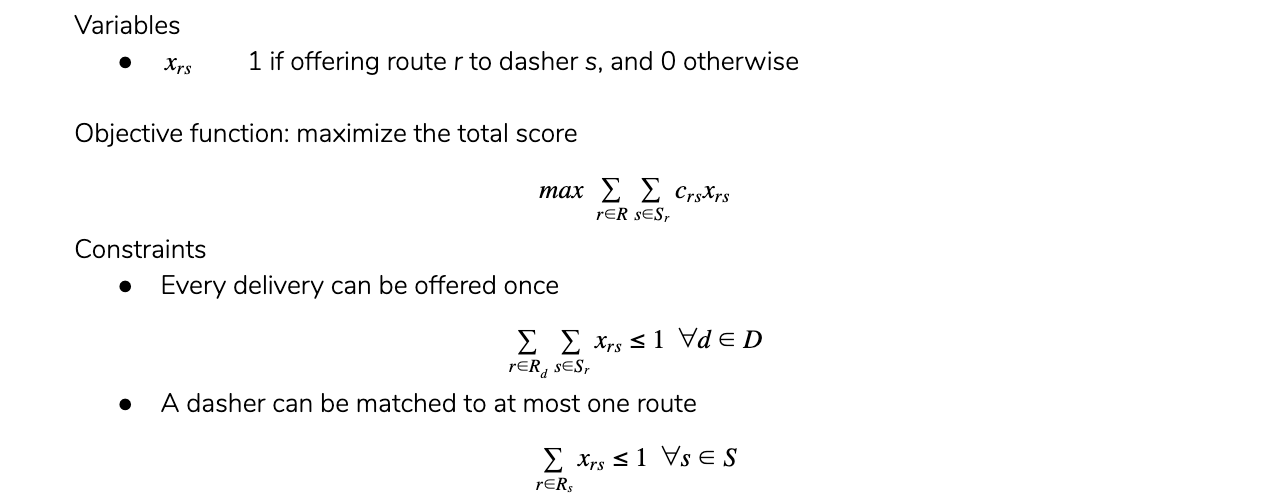
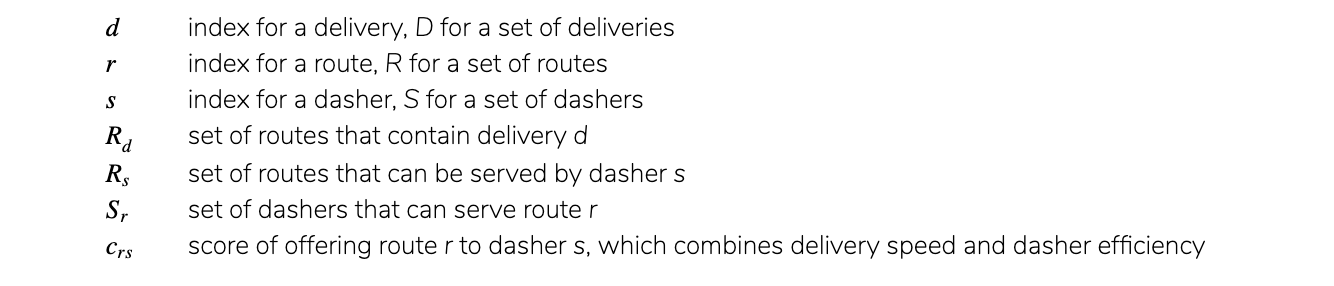
Can be solved using Mixed Integer Programming (MIP)
- {ompr}
- Also see Logistics >> Case Study: DoorDash >> Optimization
Budget Allocation
- Notes from Automate Budget Planning Using Linear Programming
- Also see Project Management >> Decision Models (details on calculations for a project budget application)
- Misc
- Top Management Guidelines are for constraints but there may be other management objectives that are part of the decision making process
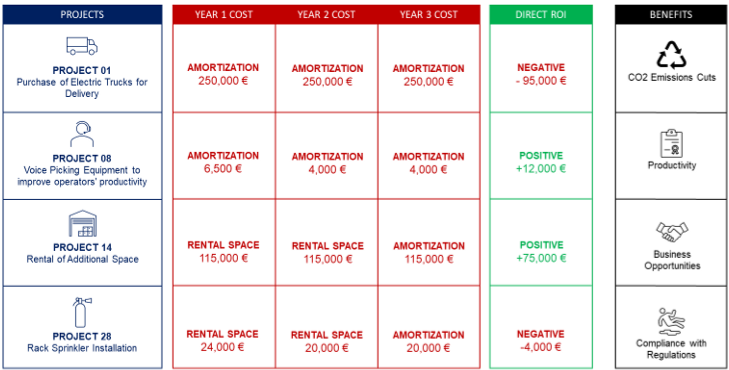
- Considerations
- Return on investment (ROI) of each project after three years (€)
- Total costs and budget limits per year (€/Year)
- Top management guidelines
- Sustainable Development (CO2 Reduction)
- Digital Transformation (IoT, Automation and Analytics)
- Operational Excellence (Productivity, Quality and Continuous Improvement)
Process
- Scenario: Budget Planning Process
- As a Regional Director you need to allocate your budget on projects
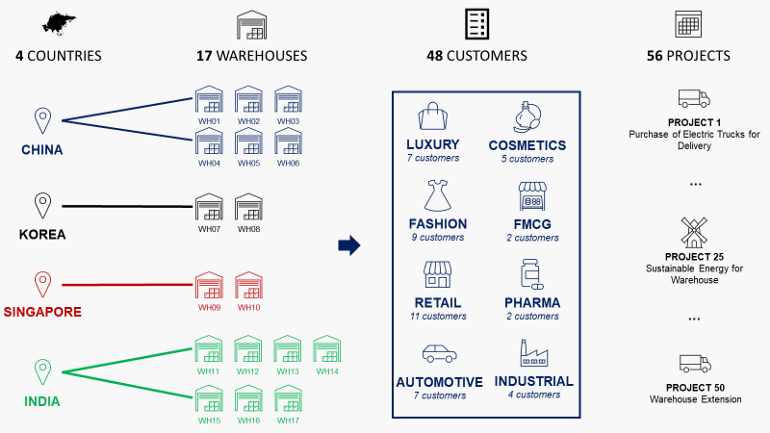
- 8 “Market Verticals”: Luxury, Cosmetics, Fashion, etc.
- As a Regional Director you need to allocate your budget on projects
- Build your Model
- Exploratory Data Analysis
- Analyze the budget applications received
- Analyze the budget applications received
- Linear Programming Model
- Decisions variables, objective function and constraints
- Objective Function: Maximize Total ROI

- Decision Variable: P is a boolean for whether project i is accepted or rejected
- Constraints
- Budget
- 4.5 M€ that you split in three years (1.25M€, 1.5M€, 1.75M€)

- 4.5 M€ that you split in three years (1.25M€, 1.5M€, 1.75M€)
- Strategic (Top Management Guidelines)

- Omin, Smin, and Dmin = 1 M€
- Other potential constraints
- Maximum budget allocation per country, market vertical, or warehouse
- Budget allocation target (95% of the budget should be allocated)
- Budget
- Initial Solution: Maximum ROI
- What would be the results if you focus only on ROI maximization? (i.e. 0 constraints)
- Might need to apply budget constraints in this step.
- What would be the results if you focus only on ROI maximization? (i.e. 0 constraints)
- Final Solution: Apply Budget and Strategic constraints to the model
- Exploratory Data Analysis
- Conclusion & Next Steps
- Create an app or dashboard
- App may involve the user being able to select different constraints or values of those constraints
- Uploads budget applications (e.g. spreadsheets)
- Visuals for EDA
- Bar or circular chart: count or percent of applications per Market Vertical
- Bar: count of applications per Management Objective
- Visuals for results of optimization
- Bar chart for each variation of constraints chosen: allocation per Management Objective
- Create an app or dashboard