Pandas, Recipes
Misc
- {{sketch}}: AI code-writing assistant for pandas users that understands the context of your data, greatly improving the relevance of suggestions. Sketch is usable in seconds and doesn’t require adding a plugin to your IDE. It’s just a regular function + method.
Transformations
Bin a numeric
df = pd.DataFrame({"value": np.random.randint(0, 100, 20){style='color: #990000'}[}]{style='color: #990000'}) labels = ["{0} - {1}".format(i, i + 9) for i in range(0, 100, 10)] df["group"] = pd.cut(df.value, range(0, 105, 10), right=False, labels=labels) df.head(10) value group 0 65 60 - 69 1 49 40 - 49 2 56 50 - 59 3 43 40 - 49 4 43 40 - 49 5 91 90 - 99 6 32 30 - 39 7 87 80 - 89 8 36 30 - 39 9 8 0 - 9qcutwill create labels, so this probably isn’t needed
Strings
Generate list of strings from a variable
s = pd.Series(["a", "b", "c", "a"], dtype="category")
new_categories = ["Group %s" % g for g in s.cat.categories]
new_categories
['Group a', 'Group b', 'Group c']
Extract city, state, and zip code from an address variable
.png)
Comparisons
equals# series series1 = pd.Series([1,2,3,4]) series2 = pd.Series([2,1,3,4]) series1.equals(series2) # dfs df["device_id"].equals(df1["device_id"]) #> True # List of the columns having different values in the DataFrames df1 and df for column in df.columns: if df[column].equals(df1[column]): pass else: print(column)- Flags differences in order, dimensions, and of course, differences in data
compare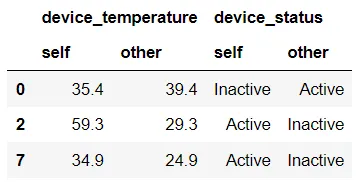
df4 = df.compare(df1) df4- device-temperature and device-status are the two common columns being compared
- self indicates the first DataFrame df and other indicates the other DataFrame df1.
- Essentially merges both the DataFrames and adds a MultiIndex to show both the DataFrames columns side by side, which helps you to see the columns and positions where the values have been changed.