Big Data
Misc
Also see
- CLI, General >> R for expressions to check file size, first 10 lines, etc. of files
- CLI, General >> AWK
- Databases, DuckDB
- Apache, Spark
- MLOps >> Dask
Dask had a major upgrade in 2024 resulting in 20x improvement: pyarrow for strings, new shuffling algorithm, query optimization (link)
Benchmark: Dask vs PySpark, DuckDB, Polars (link)
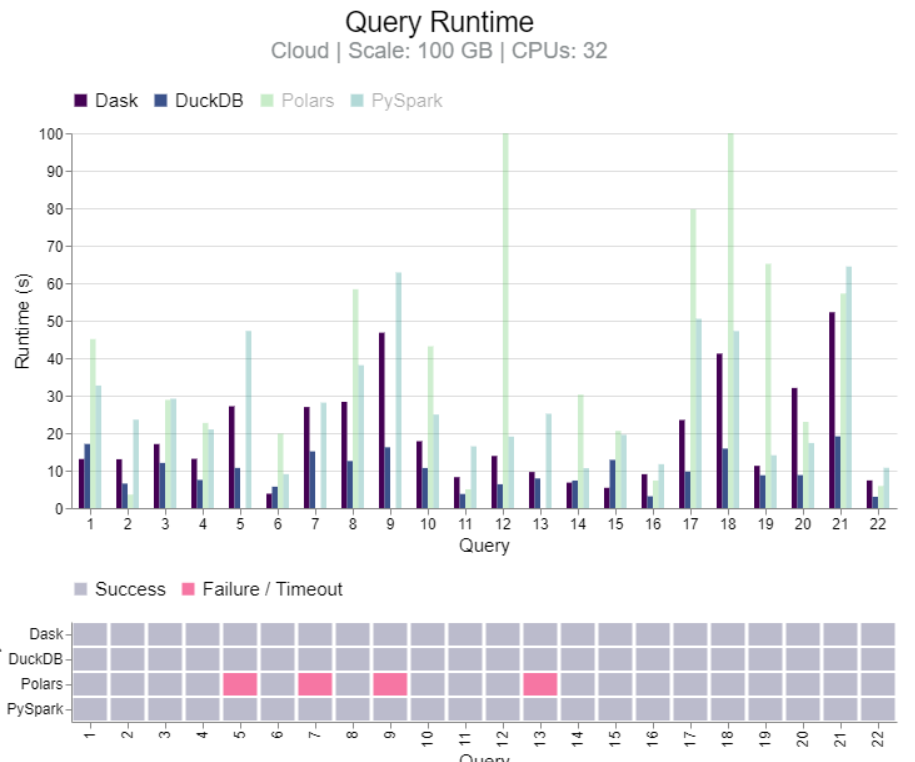
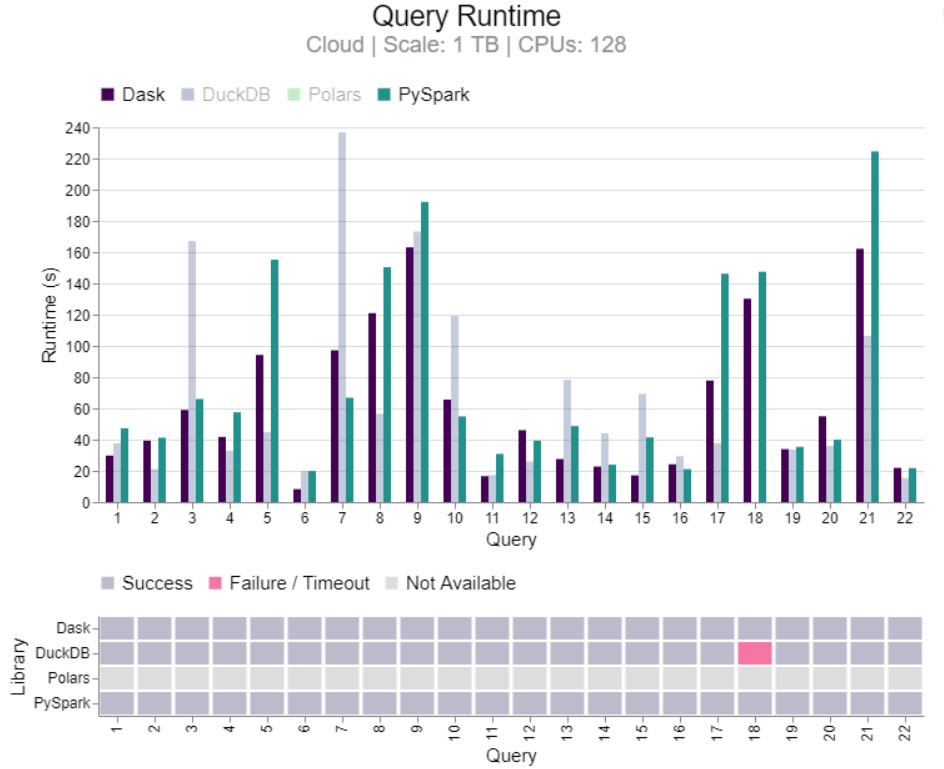
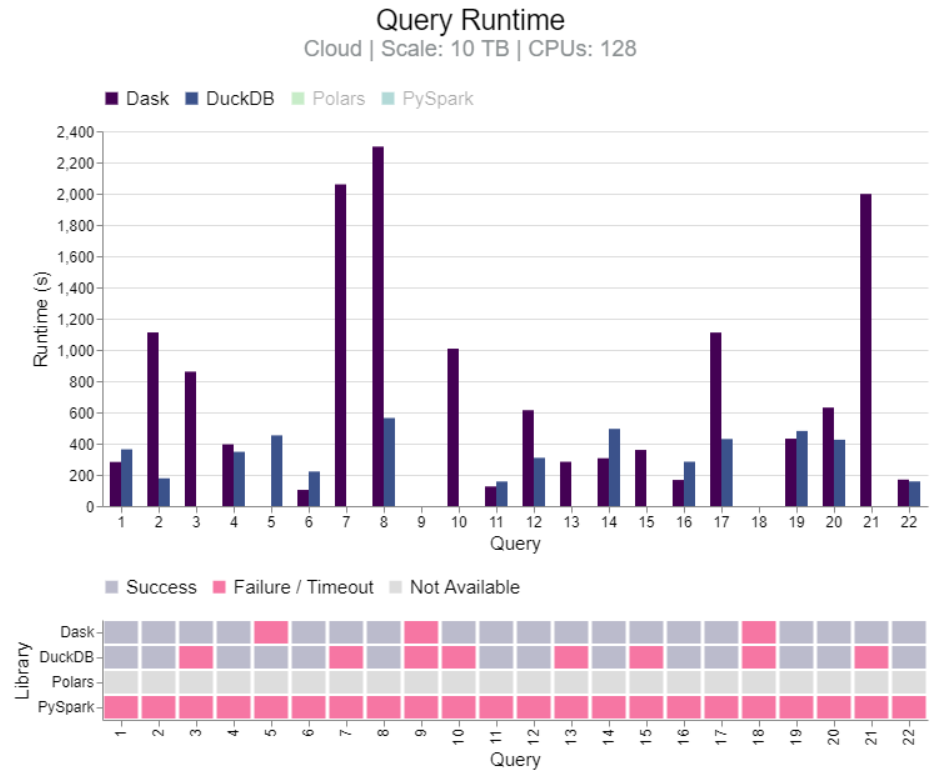
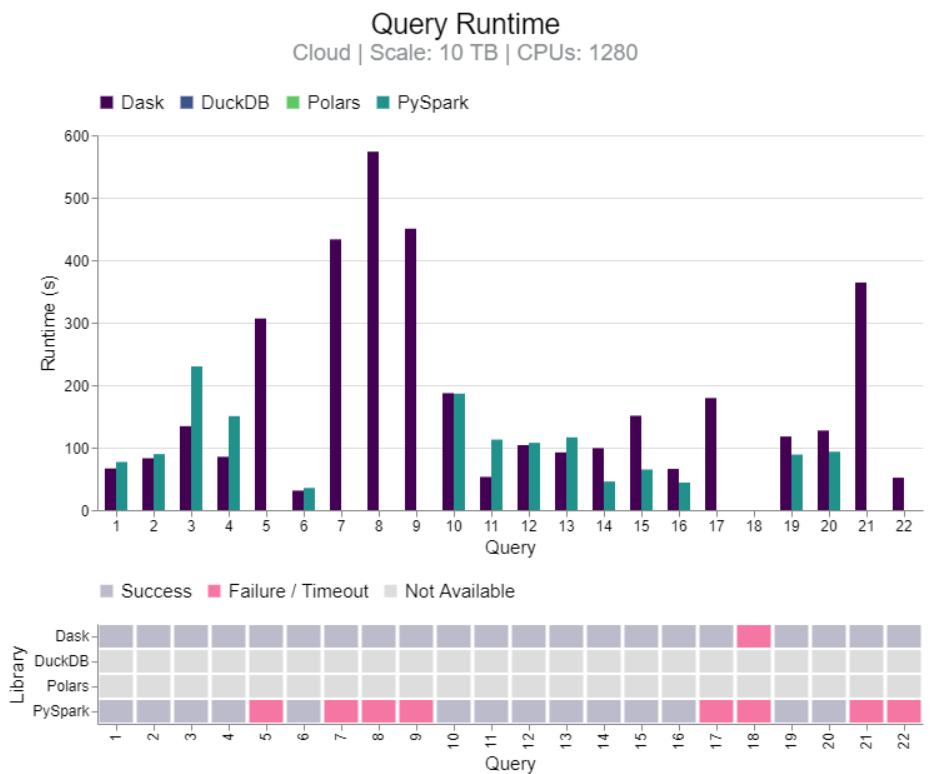
- TL;DR DuckDB clearly faster for 100GB. Results mixed between DuckDB and Dask for 1TB and 10TB, but Dask more stable at 10TB. Dask more stable than PySpark for 10TB and 1280 CPUs.
Get memory size and number of rows
# rows
fs::file_size("flights.parquet")
#> 5.43M

# size
lobstr::obj_size(nycflights13::flights)
#> 40.65 MB
Optimization Guidelines (source)
- pandas/dplyr → polars, collapse, data.table (?), etc.: For CPU-bound transformations on medium data (1-50GB)
- Benchmark: 3-5x faster for typical group-by operations
- When to switch: pandas/dplyr operations taking >30 minutes, but data fits on one machine
- polars, etc. → spark: For truly large-scale distributed processing (>50GB)
- Benchmark: Can process 1TB+ by distributing across cluster
- When to switch: Need to process multi-TB datasets, running out of memory regularly
- polars, etc. → SQL (duckdb, postgres): For aggregations and joins
- Benchmark: 10-100x faster because computation happens in the warehouse
- When to switch: Always, when the operation can be done in SQL
- When not to move to faster and potentially more complicated optimization:
- “This could be faster” (not a good reason)
- Current solution works and meets SLA
- You don’t have the expertise to operate the new tool
- pandas/dplyr → polars, collapse, data.table (?), etc.: For CPU-bound transformations on medium data (1-50GB)
Benchmarks
- Antico (2024-06-21) - Tests {collapse}, {duckdb}, {data.table}, {polars}, and {pandas}
- Compute: Windows 10 OS, Memory: 256GB, CPU: 32 cores / 64 threads
- Aggregation, Melt, Cast, Windowing (lags), Union, Left Join, Inner Join, Filter
- {collapse} best in Aggregation, Melt, Cast, Windowing
- {polars} best on joins
- The rest is mixed. Think pandas did well in few which is kind of weird since all the datasets >1M rows.
- Data Engineering Central tested libraries on lazily aggregating Delta Lake files in AWS S3 on a single node (2025)
- Uses 650GB of social media data and aggregates daily number of posts
- Uses an EC2 c5.4xlarge instance with 16 vCPU and 32GB of RAM
- Results
- {pyspark}: ~60 min
- {polars}: 12 min
- {daft}: 50 min
- {duckdb}: 16 min
- {pyspark} and {daft} are built for distributed computing, so it’s not totally surprising they sucked. The main takeaway is that large data engineering tasks can be handled on a single node on cheapish hardware.
- Antico (2024-06-21) - Tests {collapse}, {duckdb}, {data.table}, {polars}, and {pandas}
High Performance
{collapse} (Vignette): Fast grouped & weighted statistical computations, time series and panel data transformations, list-processing, data manipulation functions, summary statistics and various utilities such as support for variable labels. Class-agnostic framework designed to work with vectors, matrices, data frames, lists and related classes i.e. xts, data.table, tibble, pdata.frame, sf.
Optimize a script
options(collapse_mask = "all") library(collapse)- Optimizes any script. No other changes necessary. Quick demo.
vs arrow/polars (benchmark)
- Depends on the data/groups ratio
- If you have “many groups and little data in each group” then use collapse
- If your calculations involve “more complex statistics algorithms like the median (involving selection) or mode or distinct value count (involving hashing)(cannot, to my knowledge, benefit from SIMD)” then use collapse.
- Depends on the data/groups ratio
set_collapse(mask = "manip"|"all")to remove f- prefixesExample: groupby state + min, max, mean
D |> fgroup_by(state) |> fsummarise(min = fmin(measurement), max = fmax(measurement), mean = fmean(measurement)) |> fungroup(){fastplyr} - Has a {dplyr} API and a {collapse} backend
{cuNumeric} (intro)- Nvidia drop-in replacement for numpy that is built on the Legate framework
- Allow you to use multi-core CPUs, single or multi-GPU nodes, and even multi-node clusters without changing your Python code.
- It translates high-level array operations into a graph of fine-grained tasks and hands that graph to the C++ Legion runtime, which schedules the tasks, partitions the data, and moves tiles between CPUs, GPUs and network links for you.
{cuplyr} - A dplyr backend for GPU acceleration via RAPIDS cuDF
- Can provide significant speedups on larger datasets (typically >10M rows) without requiring major code changes.
{data.table}: Enhanced data frame class with concise data manipulation framework offering powerful aggregation, extremely flexible split-apply-combine computing, reshaping, joins, rolling statistics, set operations on tables, fast csv read/write, and various utilities such as transposition of data.
- See R, data.table
FastR - An implementation of R that can JIT compile R code to run on the Graal VM. It requires a different runtime (i.e. you can’t just run your normal R installation) and has other trade-offs, including warm-up cycles and compatibility limitations8. But otherwise you type in what you would have in normal R and see some impressive speed-ups
- When considering using matrix operations such as
choleskydecomposition in place of {Matrix}, you should determine if your use case is using dense ({Rfast}) or sparse matrices ({Matrix}) and whether you also require other functions likesolve({Matrix}).
- When considering using matrix operations such as
{kit} - Fast (implemented in C) vectorized and nested switches, some parallel (row-wise) statistics, and some utilities such as efficient partial sorting and unique values.
{matrixStats}: Efficient row-and column-wise (weighted) statistics on matrices and vectors, including computations on subsets of rows and columns.
{numba} - JIT compiler that translates a subset of Python and NumPy code into fast machine code.
{polars}: Arrow product; uses SIMD which is a low-level vectorization that can be used to speed up simple operations like addition, subtraction, division, and multiplication
- Also see R, Polars and Python, Polars
- Capable of using GPUs for up to a 10x execution time decrease.
- Polars Cloud can perform distributed computing
- Extensions: {tidypolars}, {tidypolars}
{quickr}: R to Fortran transpiler
{r2c}: Fast grouped statistical computation; currently limited to a few functions, sometimes faster than {collapse}
{Rfast}, {Rfast2}: A collection of fast functions for data analysis.
Rfast - Column- and row- wise means, medians, variances, minimums, maximums, many t, F and G-square tests, many regressions (normal, logistic, Poisson), are some of the many fast functions
Rfast2 - Regressions: Zero-Inflated, Hurdle, Repeated Measures, Tobit, Multinomial. Models: k-NN, PCA, Discriminant Analysis, Naive Bayes. Other: Hotelling, Moran’s I, Mahalanobis depth, Kaplan-Meir, Partial Correlation, Welch, cross-validataion, and much more.
The vast majority of the functions accept matrices only, not data.frames.
Do not have matrices or vectors with have missing data (i.e NAs). There are no checks and C++ internally transforms them into zeros (0), so you may get wrong results.
Example: groupby state + min, max, mean
lev_int <- as.numeric(D$state)
minmax <- Rfast::group(D$measurement, lev_int, method = "min.max")
data.frame(
    state = levels(D$state),
    mean = Rfast::group(D$measurement, lev_int, method = "mean"),
    min = minmax[1, ],
    max = minmax[2, ]
)
Larger than Memory
Misc
- Also see SQL >> Tools
- Only work with a sample of the data
- Random sample in CLI
- See binder for code
- Also this snippet from Healy for a zipped csv.
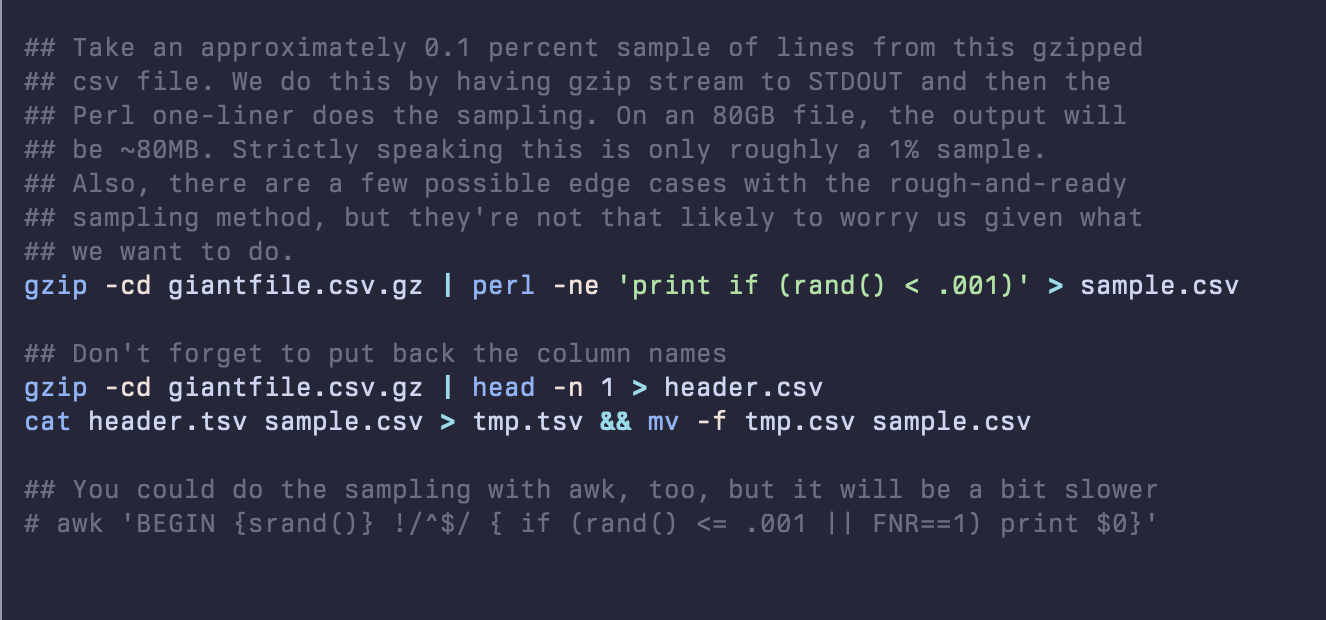
Improved version
gzip -cd giantfile.csv.gz | (read HEADER; echo $HEADER; perl -ne 'print if (rand() < 0.001)’) > sample.csv- Removes the need to decompress the file twice, adds the header row, and removes the risk of a double header row
- Only read the first n lines
- set n_max arg in
readr::read_*
- set n_max arg in
- Random sample in CLI
- Operate on chunks
Example: Filter
# Cars with 3 gears f <- function(x, pos) subset(x, gear == 3) readr::read_csv_chunked("mtcars.csv", DataFrameCallback$new(f), chunk_size = 5)- Performs a
subseton 5 rows at a time
- Performs a
- R + CLI
- sq (pronouced “seek”) - Allows people who prefer jq syntax over SQL to use jq syntax on SQL data sources
Executes jq-like queries, or database-native SQL. It can join across sources: join a CSV file to a Postgres table, or MySQL with Excel.
Outputs to a multitude of formats including JSON, Excel, CSV, HTML, Markdown and XML, and can insert query results directly to a SQL database.
Can also inspect sources to view metadata about the source structure (tables, columns, size). You can use
sq diffto compare tables, or entire databases.sqhas commands for common database operations to copy, truncate, and drop tables.Commands
add: Add data sourcecache: Manage cacheconfig: Manage configdb: Useful database actionsdiff: BETA: Compare sources, or tablesdriver: Manage driversgroup: Get or set active groupinspect: Inspect data source schema and statsls: List sources and groupsmv: Move/rename sources and groupsping: Ping data sourcesrm: Remove data source or groupsql: Execute DB-native SQL query or statementsrc: Get or set active data sourcetbl: Useful table actions (copy, truncate, drop)
Example: (source)
$ curl --silent --fail --output inthewild.db "https://pub-4c1eae2a180542b19ea7c88f1e4ccf07.r2.dev/inthewild.db"

$ sq add ./inthewild.db --handle @itw
@itw  sqlite3  inthewild.db

$ sq inspect @itw
SOURCE  DRIVER   NAME          FQ NAME            SIZE     TABLES  VIEWS  LOCATION
@itw    sqlite3  inthewild.db  inthewild.db.main  130.7MB  4       0      sqlite3:///Users/hrbrmstr/projects/sq/inthewild.db

NAME              TYPE   ROWS    COLS
_litestream_lock  table  0       id
_litestream_seq   table  1       id, seq
exploits          table  99990   id, referenceURL, timeStamp, source, type
vulns             table  260013  id, referenceURL, description, lastUpdated

$ sq --src @itw sql "SELECT id, lastUpdated FROM vulns LIMIT 5"
id             lastUpdated
CVE-1999-0001  2010-12-16
CVE-1999-0002  2009-01-26
CVE-1999-0003  2018-10-30
CVE-1999-0004  2018-10-12
CVE-1999-0005  2008-09-09

$ sq --json --src @itw '.vulns | where(.id == "CVE-2021-44228") | .description'
[
  {
    "description": "Apache Log4j2 2.0-beta9 through 2.15.0…"
  }
]
Programs
datasette.io - App for exploring and publishing data. It helps people take data of any shape, analyze and explore it, and publish it as an interactive website and accompanying API.
- Well documented, many plugins
Rill - A tool for effortlessly transforming data sets into powerful, opinionated dashboards using SQL.
- Docs, Example Projects
- Powered by Sveltekit & DuckDB = conversation-fast, not wait-ten-seconds-for-result-set fast
- Works with your local and remote datasets – imports and exports Parquet and CSV (s3, gcs, https, local)
- No more data analysis “side-quests” – helps you build intuition about your dataset through automatic profiling
- No “run query” button required – responds to each keystroke by re-profiling the resulting dataset
- Radically simple interactive dashboards – thoughtful, opinionated, interactive dashboard defaults to help you quickly derive insights from your data
- Dashboards as code – each step from data to dashboard has versioning, Git sharing, and easy project rehydration
Online duckdb shell for parquet files (gist, https://shell.duckdb.org/)
select max(wind)
from 'https://raw.githubusercontent.com/RobinL/iris_parquet/main/gridwatch/gridwatch_2023-01-08.parquet';
-- Takes 6 seconds on the first query, 200ms on subsequent similar queries

select *
from 'https://raw.githubusercontent.com/RobinL/iris_parquet/main/NSPL/NSPL.parquet'
where pcd = 'SW1A1AA';
-- Takes 13 seconds on the first query, 100ms on subsequent similar queries
CSVs
Also see Databases, DuckDB >> SQL >> CSV Parser
Quak - Quick online csv (and parquet) profiler
- Its a spreadsheet showing first 14 rows with visuals (unique categories and proportion, histograms, null count) below the column names
CSV Editors
For editing or reformatting cells
Popular spreadsheet programs like googlesheets (100MB) and excel (25MB online) have file size limits and they’re slow to upload to. The following programs are free(-ish) local alternatives only limited by your RAM.
Suggest for files over a few hundred MBs that you open as Read-Only
- Opening the files as “Editable” will probably balloon the memory cost to at least 5 times the file size. (e.g. 350MB csv \(\rightarrow\) 2GB RAM)
Modern CSV - Nice modern interface, read-only mode that can open large csvs (100s of MBs) without making much of a dent in your RAM, fully featured (moreso if you pay a small-ish one time fee)
OpenRefine - Has read-only, Several add-ons, Completely open source.
- Docs, List of Extensions
- No functionality when read-only (must create a project to do anything) — just reading
- Starts with a 1024 MB RAM usage limit which is proably fine for editing around a 100MB csv. Need to set the limit higher in a config file in order to edit larger files.
- Once you create a project, I think it has some editing features that you’d have to pay for with Modern CV.
- Opens other file formats besides csv (e.g. xlsx, xml, json, etc)
xsv - A command line program for indexing, slicing, analyzing, splitting, and joining CSV files. Written in Rust.
- Isn’t well maintained. But it is written in Rust, so may be able handle larger files that would make csvkit to slow to use.
xan - Written in Rust to leverage performance and parallelism, making it capable of handling large CSV files quickly
- Docs has more examples
- Notes from Hrbrmstr’s Daily Drop
- Previewing CSV Files:
- View: Display CSV files in the terminal for easy exploration
xan view medias.csv - Flatten: Show a flattened view of CSV records
xan slice -l 1 medias.csv | xan flatten -c
- View: Display CSV files in the terminal for easy exploration
- Filtering and Searching:
- Search: Search for rows based on specific conditions
xan search -s outreach internationale medias.csv | xan view - Filter: Use expressions to filter rows
xan filter 'batch > 1' medias.csv | xan count
- Search: Search for rows based on specific conditions
- Data Manipulation:
- Select: Choose specific columns to display
xan select foundation_year,name medias.csv | xan view - Sort: Sort the CSV file based on a column
xan sort -s foundation_year medias.csv | xan select name,foundation_year | xan view -l 10 - Deduplicate: Remove duplicate rows based on a column
xan dedup -s mediacloud_ids medias.csv | xan count
- Select: Choose specific columns to display
- Data Analysis:
- Frequency: Compute frequency tables for a column
xan frequency -s edito medias.csv | xan view - Histogram: Print a histogram for a column
xan frequency -s edito medias.csv | xan hist - Statistics: Compute descriptive statistics for columns
xan stats -s indegree,edito medias.csv | xan transpose | xan view -I
- Frequency: Compute frequency tables for a column
- Data Transformation:
- Map: Create a new column by evaluating an expression
xan map 'fmt("{} ({})", name, foundation_year)' key medias.csv | xan select key | xan slice -l 10 - Transform: Transform a column by evaluating an expression.
xan transform name'split(name, ".") | first | upper' medias.csv | xan select name | xan slice -l 10
- Map: Create a new column by evaluating an expression
- Aggregation:
- Aggregate: Perform custom aggregation on columns
xan agg'sum(indegree) as total_indegree, mean(indegree) as mean_indegree' medias.csv | xan view -I - Groupby: Group rows and perform per-group aggregation
xan groupby edito'sum(indegree) as indegree' medias.csv | xan view -I
- Aggregate: Perform custom aggregation on columns
csvkit - Suite of command-line tools for converting to and working with CSV. Written in Python.
Installation docs
Notes from
- Article with additional examples and options
Features
- Print CSV files out nicely formatted
- Cut out specific columns
- Get statistical information about columns
Convert excel files to CSV files:
in2csv excel_file.xlsx > new_file.csv
# +remove .xlsx file
in2csv excel_file.xlsx > new_file.csv && rm excel_file
Search within columns with regular expressions:
csvgrep -c county -m "HOLT" new_file.csv # subset of columns (might be faster) with pretty formatting csvcut -c county,total_cost new_file.csv | csvgrep -c county -m "HOLT" | csvlook- Searches for “HOLT” in the “county” column
Query with SQL
- syntax
csvsql --query "ENTER YOUR SQL QUERY HERE" FILE_NAME.csv - Example

- syntax
View top lines:
head new_file.csvView columns names:
csvcut -n new_file.csvSelect specific columns:
csvcut -c county,total_cost,ship_date new_file.csv- With pretty output:
csvcut -c county,total_cost,ship_date new_file.csv | csvlook - Can also use column indexes instead of names
- With pretty output:
Join 2 files:
csvjoin -c cf data1.csv data2.csv > joined.csv- “cf” is the common column between the 2 files
EDA-type stats:
csvstat new_file.csv
# subset of columns
csvcut -c total_cost,ship_date new_file.csv | csvstat
JSON
- JSONata - A lightweight, open-source query and transformation language for JSON data, inspired by the ‘location path’ semantics of XPath 3.1.
- Misc
- Notes from: Hrbrmstr’s article
- JSONata also doesn’t throw errors for non-existing data in the input document. If during the navigation of the location path, a field is not found, then the expression returns nothing.
- This can be beneficial in certain scenarios where the structure of the input JSON can vary and doesn’t always contain the same fields.
- Treats single values and arrays containing a single value as equivalent
- Both JSONata and jq can work in the browser (JSONata embedding code, demo), but jq has a slight speed edge thanks to WASM. However, said edge comes at the cost of a slow-first-start
- Features
- Declarative syntax that is pretty easy to read and write, which allows us to focus on the desired output rather than the procedural steps required to achieve it
- Built-in operators and functions for manipulating and combining data, making it easier to perform complex transformations without writing custom code in a traditional programming language like python or javascript
- User-defined functions that let us extend JSONata’s capabilities and tailor it to our specific needs
- Flexible output structure that lets us format query results into pretty much any output type
- Misc
- jq - A lightweight and flexible command-line JSON processor written in portable C.
- jq + jsonlite example
- jsoncrack.com - online editor/tool to visualize nested json (or regular json)
- jj - cli tool for nested json. Full support for ndjson as well as setting/updating/deleting values. Plus it lets you perform similar pretty/ugly printing that jq does.
- sqlite3 - CLI utility allows the user to manually enter and execute SQL statements against an SQLite database or against a ZIP archive.
- also directly against csv files (post)
- textql - Execute SQL against structured text like CSV or TSV
- Require Go language installed
- Only for Macs or running a docker image
- columnq-cli - sql query json, csv, parquet, arrow, and more
R
{arrow}
- Convert file into parquet files
- pass the file path to
open_dataset, usegroup_byto partition the Dataset into manageable chunks - use
write_datasetto write each chunk to a separate Parquet file—all without needing to read the full CSV file into R
- pass the file path to
- dplyr support
- Convert file into parquet files
-
- Option for data > 10M rows and you only have access to one machine
- Spreads data over local cores
{sparklyr}
- Spin up a spark cluster
- dplyr support
- Set-up a cloud bucket and load data into it. Then, read into a local spark cluster. Process data.
{h2o}
h2o.import_file(path=path)holds data in the h2o cluster and not in memory
{disk.frame}
- Supports many dplyr verbs
- Supports future package to take advantage of multi-core CPUs but single machine focused
- State-of-the-art data storage techniques such as fast data compression, and random access to rows and columns provided by the fst package to provide superior data manipulation speeds
Matrix ops
- See bkmks: mathematics >> packages
{ff}
- See bkmks: data >> loading/saving/memory
- Think it converts files to a ff file type, then you load them and use
ffapplyto perform row and column operations with base R functions and expressions - May not handle character and factor types but may work with {bit} pkg to solve this
Viz
- Scatter plots
- {scattermore}
- {ggpointdensity}
- {ggrastr}
Rasterize only specific layers of a ggplot2 plot (for instance, large scatter plots with many points) while keeping all labels and text in vector format. This allows users to keep plots within a reasonable size limit without losing the vector properties of scale-sensitive information.
Example
geom_point <- function(...) {
  ggrastr::rasterise(ggplot2::geom_point(...), dpi = 300)
}
- {deepscatter} (Thread (using Arrow, duckdb)) - Zoomable, animated scatterplots in the browser that scales over a billion point
- {dbplot} - Plots data in databases and Spark Clusters
- {gglinedensity} - Provides a “derived density visualisation (that) allows users both to see the aggregate trends of multiple (time) series and to identify anomalous extrema.”
- {h2o::h2o.aggregator} (article)- Reduces data size to a representive sample, then you can visualize a clustering-based method for reducing a numerical/categorical dataset into a dataset with fewer rows
- A count column is added to show how many rows is represented by the exemplar row (I think)
- Aggregator maintains outliers as outliers but lumps together dense clusters into exemplars with an attached count column showing the member points.
- For cat vars:
- Accumulate the category frequencies.
- For the top 1,000 or fewer categories (by frequency), generate dummy variables (called one-hot encoding by ML people, called dummy coding by statisticians).
- Calculate the first eigenvector of the covariance matrix of these dummy variables.
- Replace the row values on the categorical column with the value from the eigenvector corresponding to the dummy values.
- {mosaicr} - A framework for linking databases and interactive views
- Scalable visualizations that handle millions of data points efficiently
- Interactive dashboards with client-side interactions
- Database integration with optimized query processing
- Grammar of graphics approach to visualization specification
- Supports
- HTML Widget Integration: Works in R Markdown, Jupyter notebooks, and standalone HTML
- Shiny Support: Full integration with Shiny applications
- Database Backend: Efficient data processing with DuckDB
- Arrow Format: Optimized data transfer using Apache Arrow
- {plotly-resampler} - Improves the scalability of Plotly for visualizing large time series datasets.
- Dynamically aggregates time-series data respective to the current graph view, ensuring efficient and responsive updates during user interactions like panning or zooming via callbacks.
- {shinyHugePlot} - A tool to plot data with a large sample size using ‘shiny’ and ‘plotly’. Relatively small samples are obtained from the original data using a dynamic sampler algorithm (Uses {plotly-resampler})
Modeling
RcppArmadillo::fastLmPureNot sure what this does but it’s rcpp so maybe faster than lm for big data..lm.fitis a base R lm function that is 30%-40% faster than lm.- {BayesForge} (Website) - A high-performance probabilistic programming library that aims to unify the modeling experience by providing an intuitive model-building syntax together with the flexibility of low-level abstraction coding.
- Built on top of Numpyro, TensorFlow Probability, and Jax for cpu, gpu and tpu vectorization and parallelization
- Available in Python, R, and Julia
- {biglmm} - Bounded Memory Linear and Generalized Linear Models
- Regression for data too large to fit in memory. This package functions exactly like the biglm package, but works with later versions of R.
- {capybara} - Fast and Memory Efficient Fitting of Linear Models with High-Dimensional Fixed Effect
- Also glms, poisson, and negative binomial models
- Facilites computing clustered standard errors.
- The summary tables borrow from Stata outputs and integrations with {broom} are provided
- Slightly slower than {fixest}, but with a smaller memory footprint
- {dbreg} - Leverages the power of databases to run regressions and fixed effects regressions on very large datasets, which may not fit into R’s memory.
- Various acceleration strategies allow for highly efficient computation, while robust standard errors are computed from sufficient statistics.
- DuckDB is the default backend , but users can also specify alternative database backends
- {duckreg} - Run stratified/saturated regressions out-of-memory with duckdb
- Python version of {dbreg}
- Provides a simple interface to run regressions on very large datasets that do not fit in memory by reducing the data to a set of summary statistics and runs weighted least squares with frequency weights.
- Robust standard errors are computed from sufficient statistics, while clustered standard errors are computed using the cluster bootstrap.
- {fastglm} - A re-write of
glmusing RcppEigen designed to be computationally efficient and algorithmically stable- Also includes Negative Binomial, Zero-Inflated, and Hurdle models
- {glm4} - Fits Generalised Linear Models (GLMs) with sparse and dense ‘Matrix’ matrices for memory efficiency
- {irls} - Generalized Linear Models via Iteratively Reweighted Least Squares. Supports Logistic, Poisson, and Gamma
- {modeldb} - Fit models inside the database. Works with most database back-ends because it leverages dplyr and dbplyr for the final SQL translation of the algorithm.
- Currently supports linear regression and k-means clustering
- {rcppmlpackexamples} - Provides examples for accessing the C++ API of {mlpack} from the C++ side of an R package.
- {mlpack} - A fast, flexible machine learning library, written in C++, that aims to provide fast, extensible implementations of cutting-edge machine learning algorithms. Uses Rcpp.
- {speedglm} - Fitting Linear and Generalized Linear Models to Large Data Sets
- {subsampling} - Optimal Subsampling Methods for Statistical Models
- A technique to balance the trade-off between computational efficiency and statistical efficiency when high compute resources are unavailable.
- Provides optimal subsampling methods for various statistical models such as generalized linear models (GLM), softmax (multinomial) regression, rare event logistic regression and quantile regression model.
- {tidymodels} database predicting packages
- {orbital} - Enables running predictions of tidymodels workflows inside databases.
- {tidypredict} - Used as the primary parser for models employed by the orbital
- Articles
- Supported Models
- Linear Regression -
lm() - Generalized Linear model -
glm() - Regularized Regression -
glmnet::glmnet- Logistic, Multinomial, Linear
- MARS models -
earth::earth() - Cubist models -
Cubist::cubist() - Decision Tree models
partykit-partykit::ctree()- {rpart}
- Random Forest models
ranger-ranger::ranger()randomForest::randomForest()
- Boosted models
xgboost::xgb.Booster.complete()- {catboost}
- {lightgbm}
- Linear Regression -
- Examples
Example: Basic {tidypredict}
model <- partykit::ctree(mpg ~ am + cyl, data = mtcars)
tidypredict_fit(model)
#> case_when(cyl <= 4 ~ 26.6636363636364, cyl <= 6 & cyl > 4 ~ 19.7428571428571,
#>     .default = 15.1)

model <- glmnet::glmnet(mtcars[, -1], mtcars$mpg, lambda = 0.01)
tidypredict_fit(model)
#> 13.0081464696679 + (cyl * -0.0773532164346008) + (disp * 0.00969507138358544) +
#>     (hp * -0.0192462098902709) + (drat * 0.816753237688302) +
#>     (wt * -3.41564341709663) + (qsec * 0.758580151032383) + (vs *
#>     0.277874296242861) + (am * 2.47356523820533) + (gear * 0.645144527527598) +
#>     (carb * -0.300886812079305)
- {VectorForgeML} - High-Performance Machine Learning Framework with C++ Acceleration
- Decison Trees, K Means, KNN, Linear and Logistic Regression, PCA, Random Forest, Ridge Regression, and Softmax Regression
- Min-max scaling, one hot encoding, model scoring, pipeline class
Reading and Writing
- {fst}: A compressed data file format that is very fast to read and write. Full random access in both rows and columns allows reading subsets from a ‘.fst’ file.
- A fast, easy and flexible way to serialize data frames. With access speeds of multiple GB/s, fst is specifically designed to unlock the potential of high speed solid state disks that can be found in most modern computers
- {qs2} - Efficient Serialization of R Objects Streamlines and accelerates the process of saving and loading R objects, improving speed and compression compared to other methods.
- {zap} - Quickly serialize R objects with high comopression using a custom serialization framework.
- Lossless transformation is performed on atomic types making them easier to compress; this means that compression can be better and faster than built-in methods.
- Includes an implementation of the floating-point compression algorithm