Tools
Misc
- The 2024 MAD (Machine Learning, AI & Data) Landscape
- Zalando Tech Radar - Radar plot grading tech tools with levels: Hold, Assess, Trial, and Adopt and categories: Datastores, Data Management, Languages, Infrastructure
- pricelevel - What companies actually pay for software. PriceLevel gives you visibility into the price hidden behind “Contact Us”.
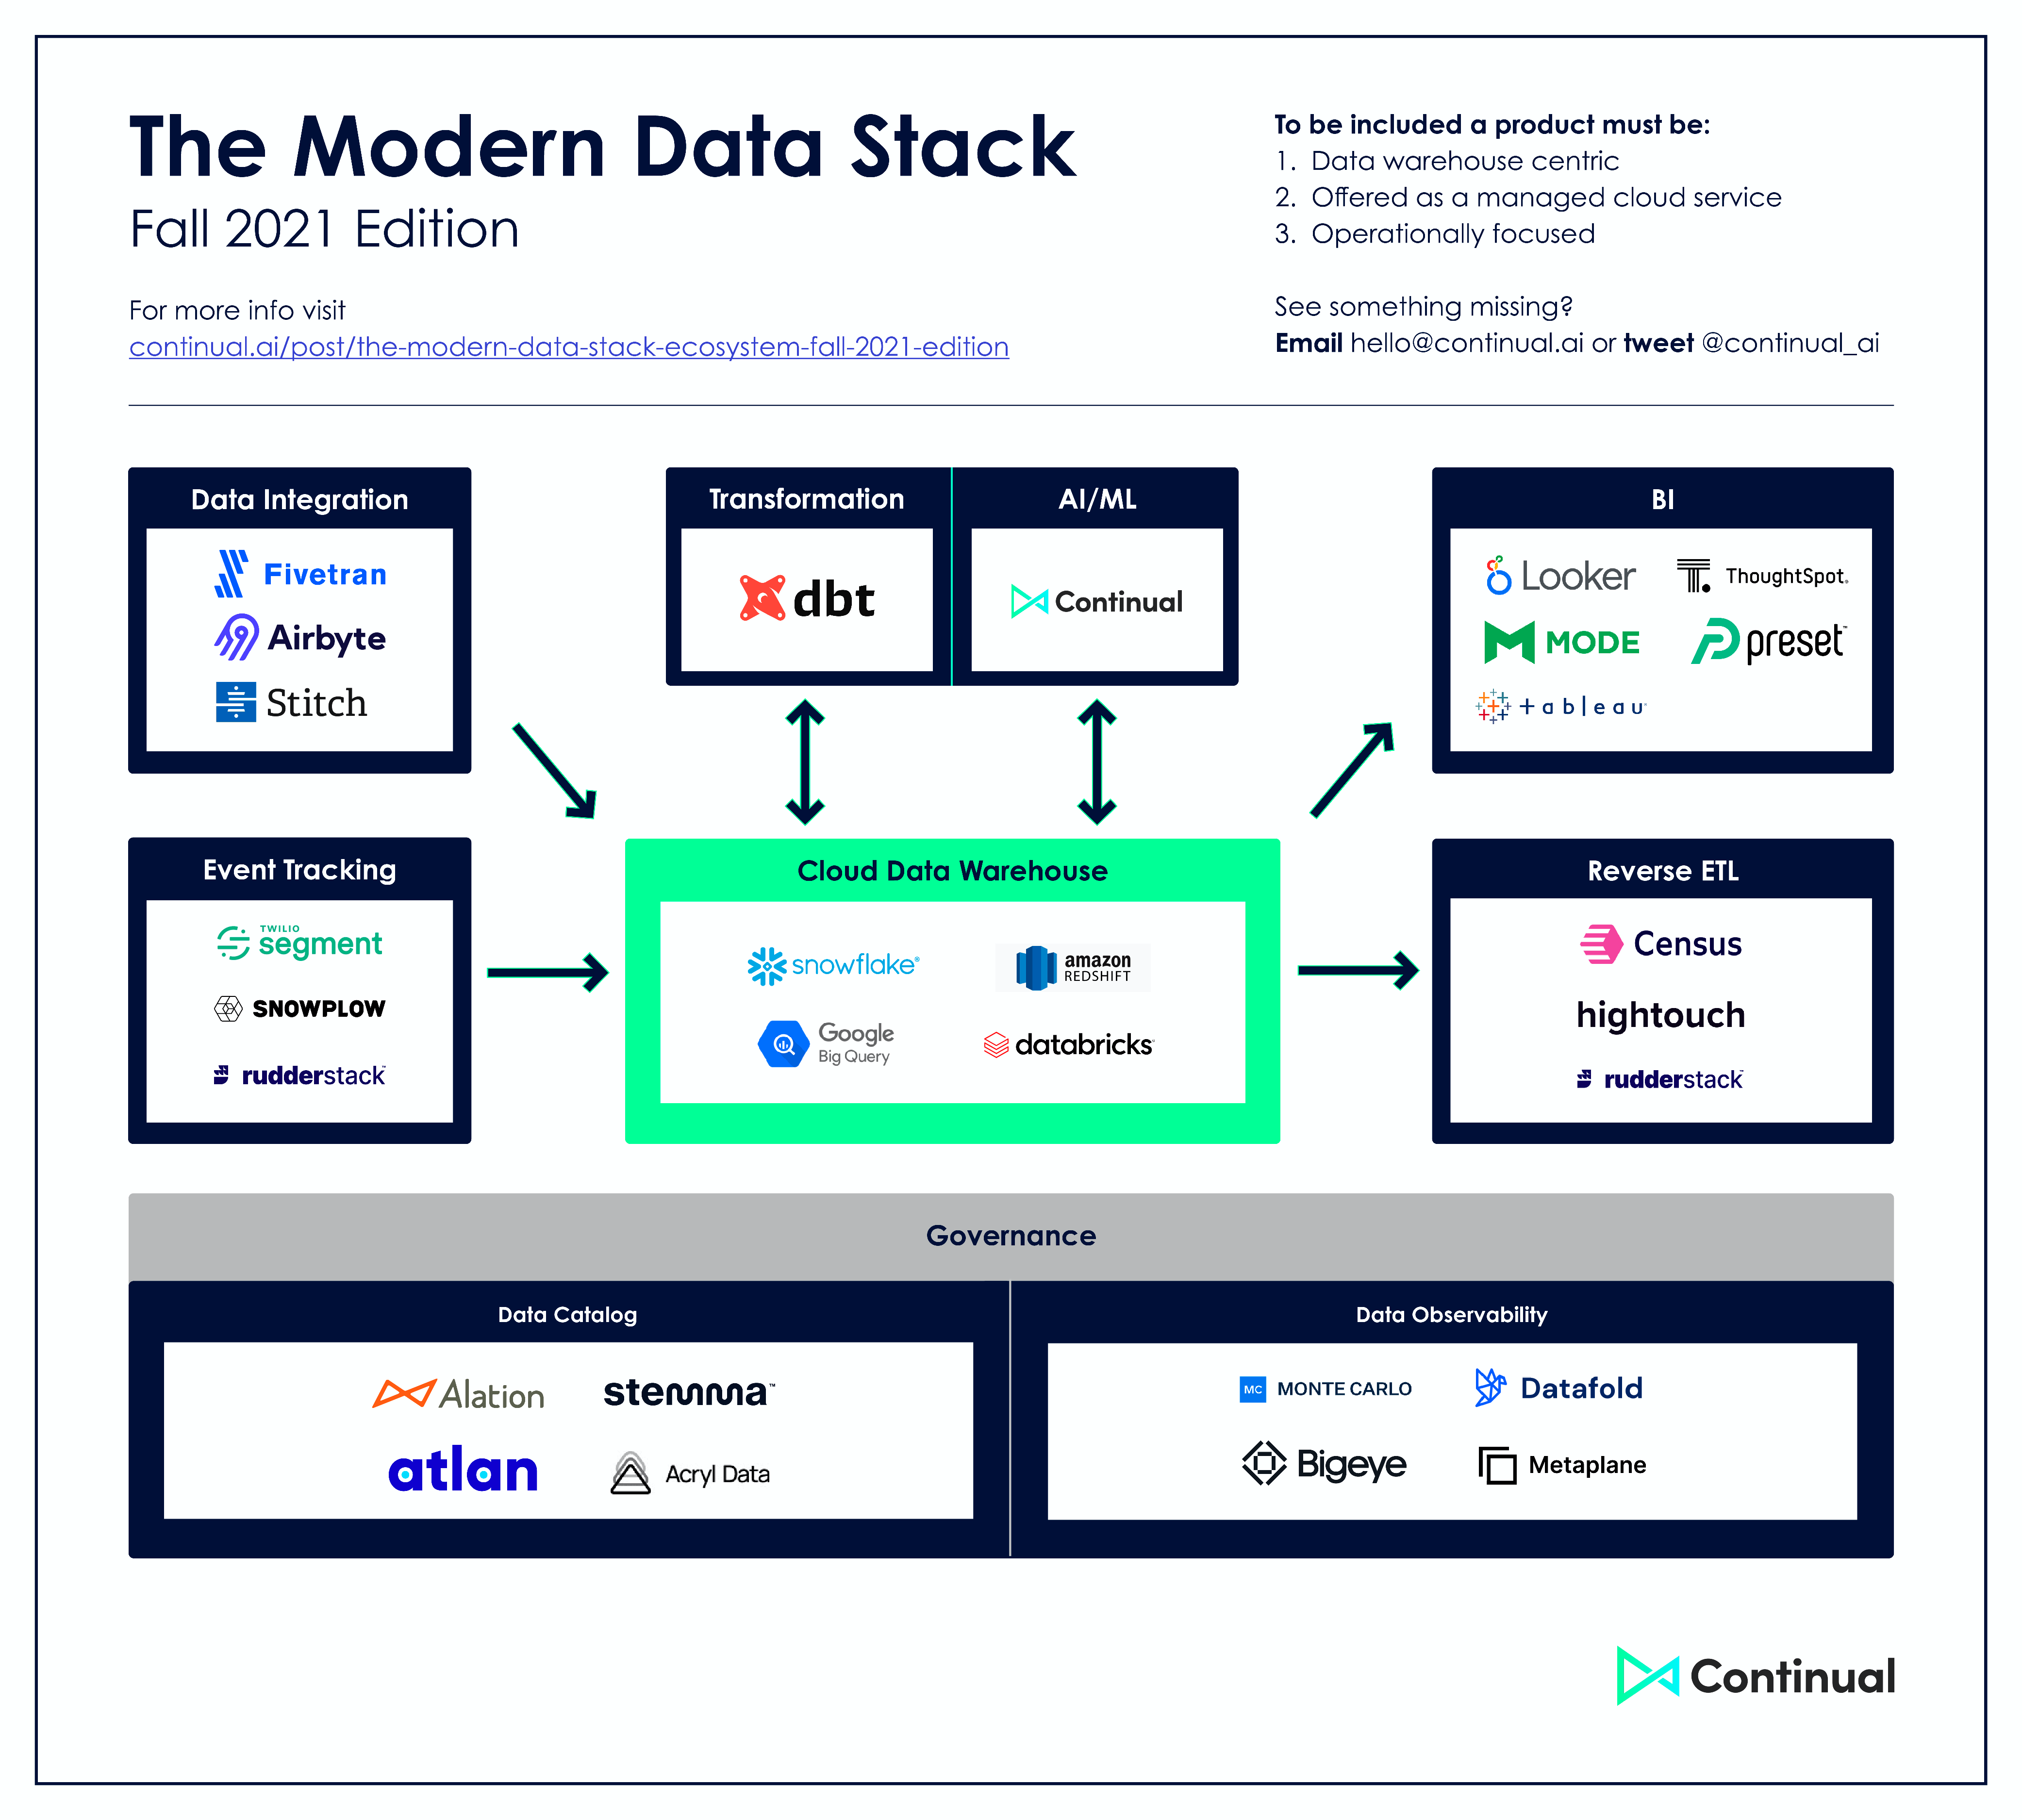
- Overview of some 2021 tools Descriptions in article
- AWS Batch - Managed service for computational jobs. Alternative to having to maintain a kubernetes cluster
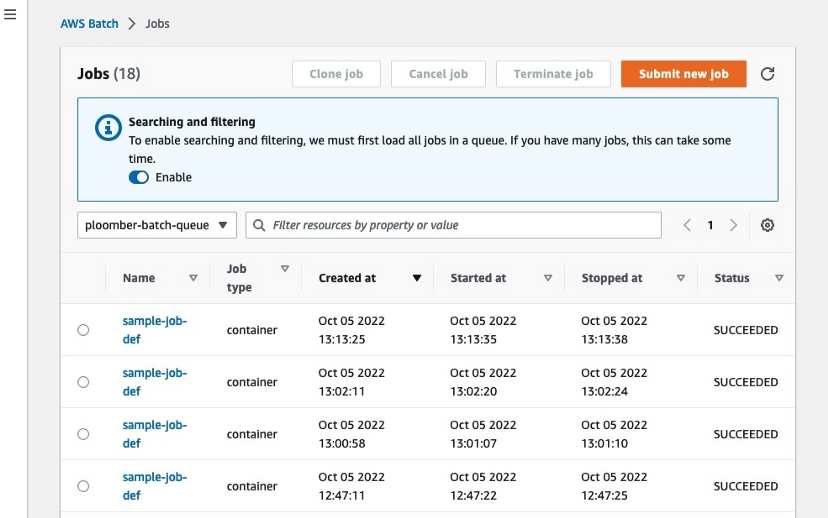
- Takes care of keeping a queue of jobs, spinning up EC2 instances, running code and shutting down the instances.
- Scales up and down depending on how many jobs submitted.
- Allows you to execute your code in a scalable fashion and to request custom resources for compute-intensive jobs (e.g., instances with many CPUs and large memory) without requiring us to maintain a cluster
- See bkmks: Hosting >> AWS >> Batch
- Packages:
Platforms
- Misc
- Notes from
- For a Stage 1 (maturity) company with AI ambitions and a small team that can’t afford to manage five different tools, bringing everything together is genuinely appealing. Pricing and readiness can be a challenge though.
- Platform account managers will be enthusiastic. They’ll set up meetings, walk you through demos, and make a compelling case. They’re good at their jobs.
- Keep the relationship, but do your own homework independently. Set-up a trial. Map your actual jobs, data volumes, and query patterns to realistic consumption before you commit. Do not skip that step.
- Connecting on-prem data storage to a platform isn’t straightforward. Options:
- Set-up a gateway and whitelist IPs
- Build an API
- Better from a security standpoint that the gateway
- Set up an on-premises service that acts as a bridge. Data is extracted from source systems, moved into cloud storage via that bridge.
- This is vague and don’t know what it refers to
- Databricks
- Spark is the primary feature, so if you aren’t transforming enough data, the other features may not be worth it.
- Rewards teams that can invest deeply in it, but you need a team that can manage (enough of) it.
- Pricing is based on DBUs (Databricks Units), which are consumption-based and vary by workload type and cluster configuration.
- At a large scale, the model makes sense. For small workloads, you can find yourself paying real money for jobs that don’t justify it. A transformation job spins up a cluster, does ten seconds of work, and bills you for the minimum runtime.
- It adds up in ways that are hard to predict
Data Versioning
- dbt
- Flat Table by Github
- Has a Github action associated with it
- Has a datetime commit message
- Lists as a feature that it tracks differences from one commit to the next, but doesn’t a normal data commit doe the same thing?
- Lumberjack R package
- Add functions to your processing script
- tracks using a log file
- options for changes you want to track
Data Ingestion
- Also see Databases, Engineering >> Event Tracking, Streaming, Other Tools
- Notes from Madison Mae’s Data Pipeline Summer series
- Data ingestion tools are expensive. The best, most reliable tools aren’t affordable for many companies. You’re then forced to decide between cost or reliability.
- When deciding on a data ingestion tool to use, it is best to consider the following factors:
- Available connectors
- Technical skills of your team
- Budget
- Time available to implement
- Integration with other data stack tools
- Debugging and alerting features
- Technical support (Paid or enterprise doesn’t always equal more/better service)
- Concepts
- Sync Methods
- Make sure the settings of your sync match the expectations you have around your data
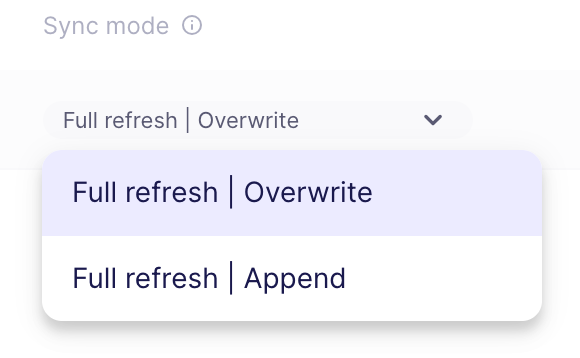
- Full Refreshes
- Removes any data that has been written to a table and loads all of the data fully each time.
- Append Option - Removes the initial deletion step. This will continually append all of the available data to the data already in the existing table.
- This creates lots of duplicates and very large tables, negatively impacting performance and making transformation downstream necessary.
- Incremental Syncs
- Compares timestamps in your data, only syncing data new to your source since the last time data was ingested. This helps to decrease data volume and prevent duplicates.
- Append - Simply adds all new records to the data already in a table which can result in duplicates.
- This would require you to handle any updated records in your data models
- Dedupe - Appends new data and updates existing records if the data has changed.
- Utilizes an UPSERT and MERGE strategy to compare the primary keys of already existing records in your table, updating the field values with anything that has changed.
- Propagating Schema Changes
- Actions you want taken when the schema of an ingested table changes
- Options
- Accept the changes automatically
- Immediately pause the connector and wait for approval
- Continue on with the old schema
- Consider the effects on your pipeline
- How are your staging models defined?
- What dependencies exist within dbt and in your BI tool?
- How well do engineering and data teams communicate?
- Raw vs Normalized Data
- Data straight from the source is typically sent as JSON, but most tools will give you the option to normalize it.
- JSON
- Gives you the freedom to parse the data as you wish (normalizing it directly within a tool like dbt), but requires more upfront work.
- Normalized
- Refers the normalization forms in relational databases (See Databases, Normalization >> Forms)
- Allows you to quickly act on the data, but may provide you with more trouble in terms of performance overhead due to the transformations involved
- I think this is also related to dedupe method of incremental sync
- Sync Methods
- FiveTran
- Free-tier
- Sync raw data sources
- Every 1hr for starter plan, every 15 minutes both standard plans, every 5 min for enterprise plan
- Airbyte
- Local set-up is free (Pricing)
- Cloud-hosted gives you 14-days for free to try it out
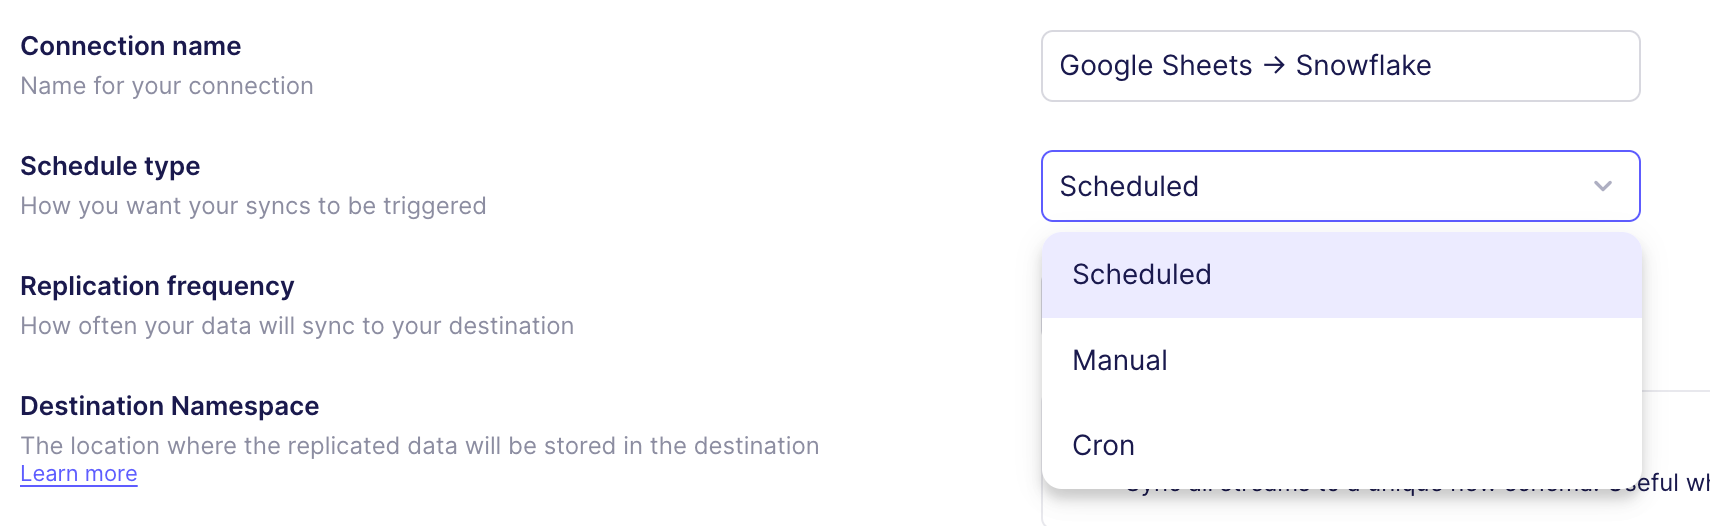
- Example: Connect Googlesheets to Snowflake (source)
- Create a cloud account
- Create a new connection to Google Sheets
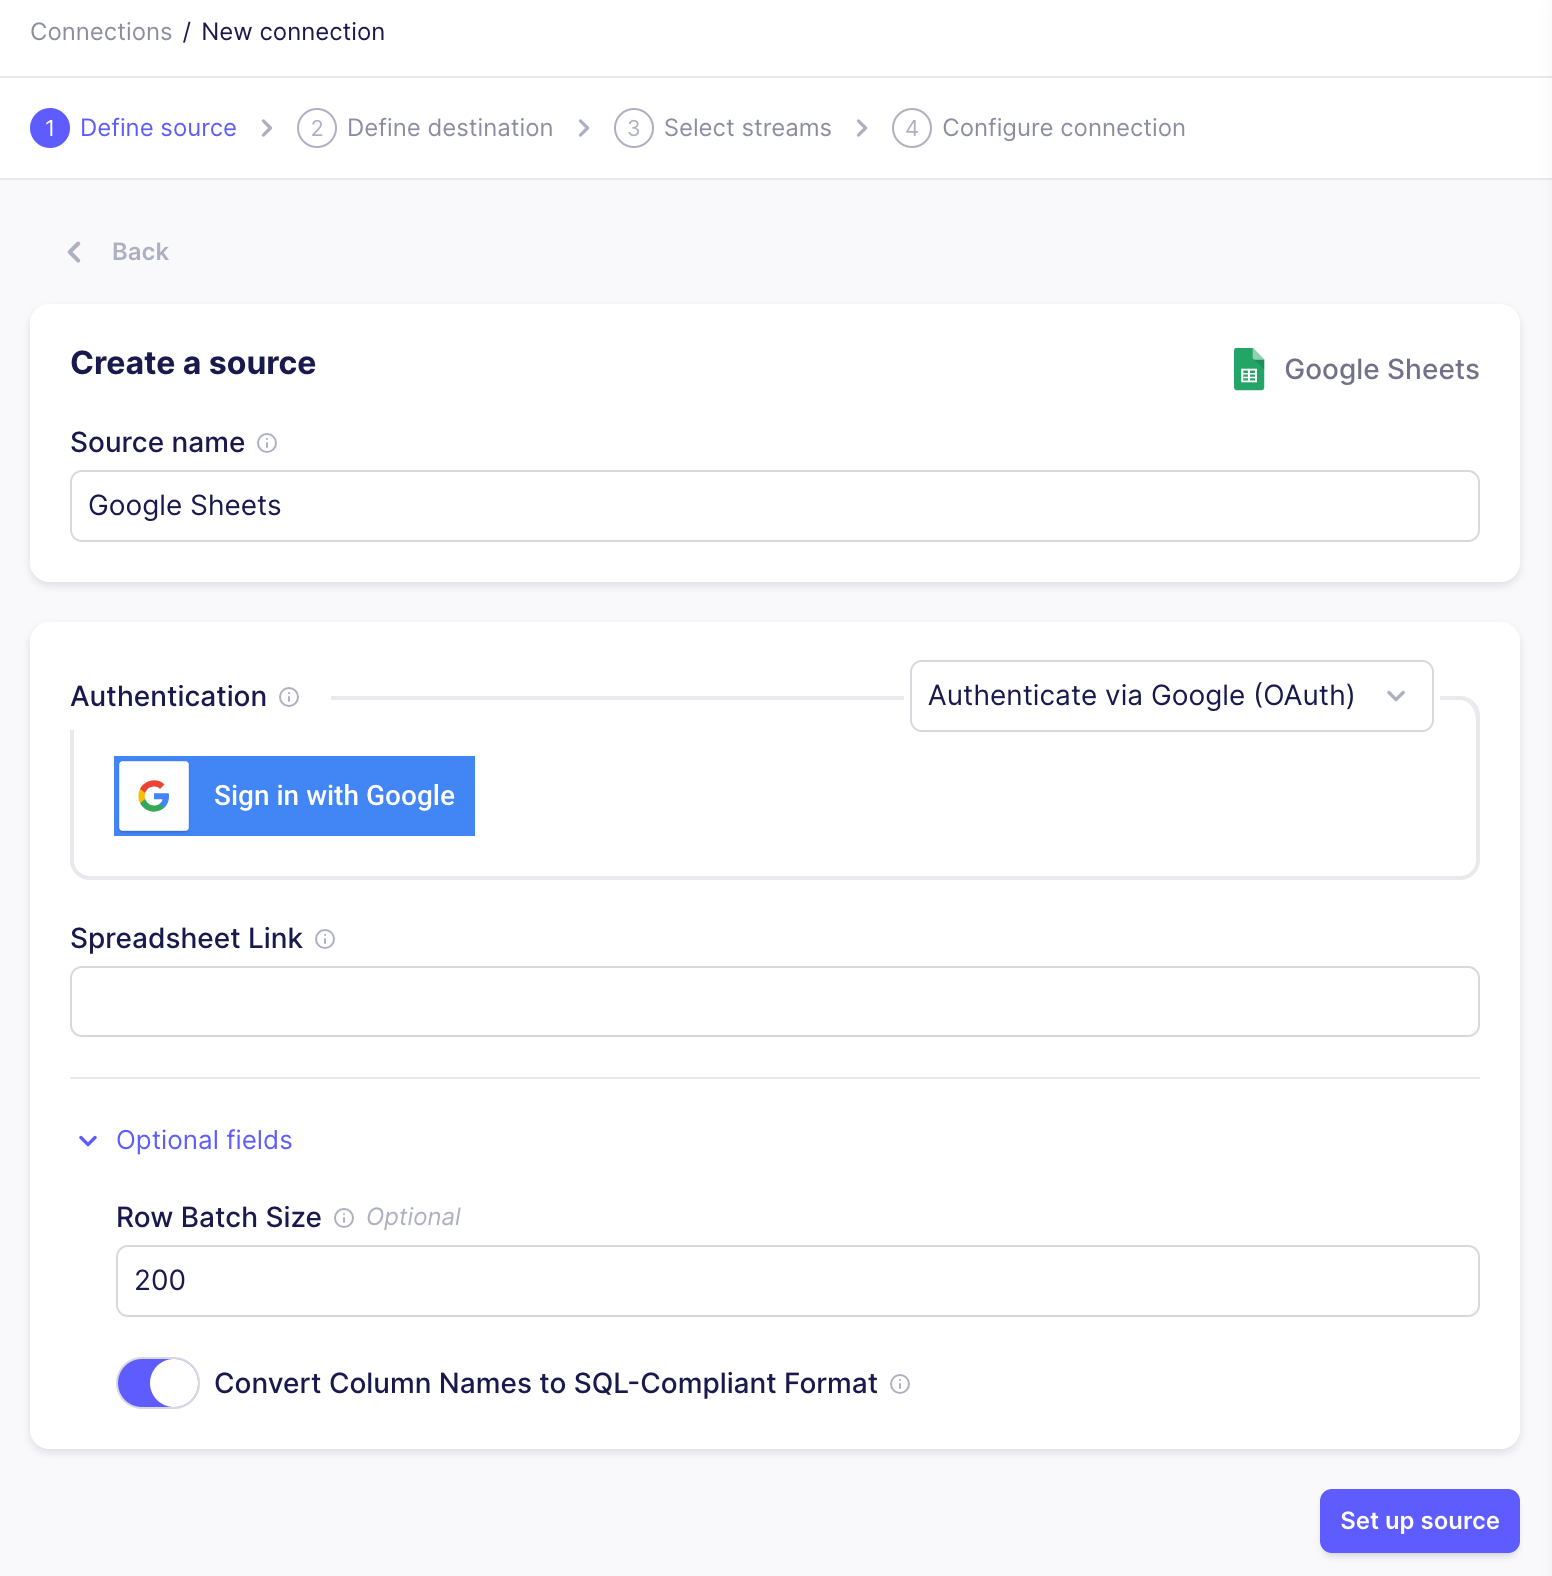
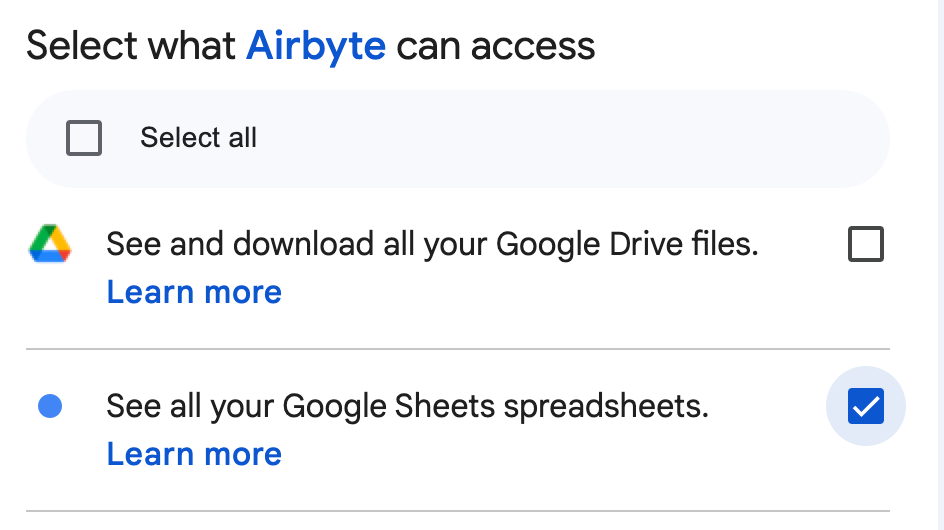
- Authenticate your account by logging into the Google account that has access to the spreadsheet. Give Google access to your Google Sheets
- Input the link to the spreadsheet and make sure “Convert Column Names to SQL-Compliant Format” is toggled on. This will make sure your field names don’t contain spaces and can easily be queried using SQL.
- Test the connection. If successful, you will be directed to a page listing the destinations. Select Snowflake.
- Airbyte will give you a script to execute in snowflake for setting up variables (See Databases, Snowflake)
- Set Sync Mode and Sync Schedule
- (Optional) Set schema change handling
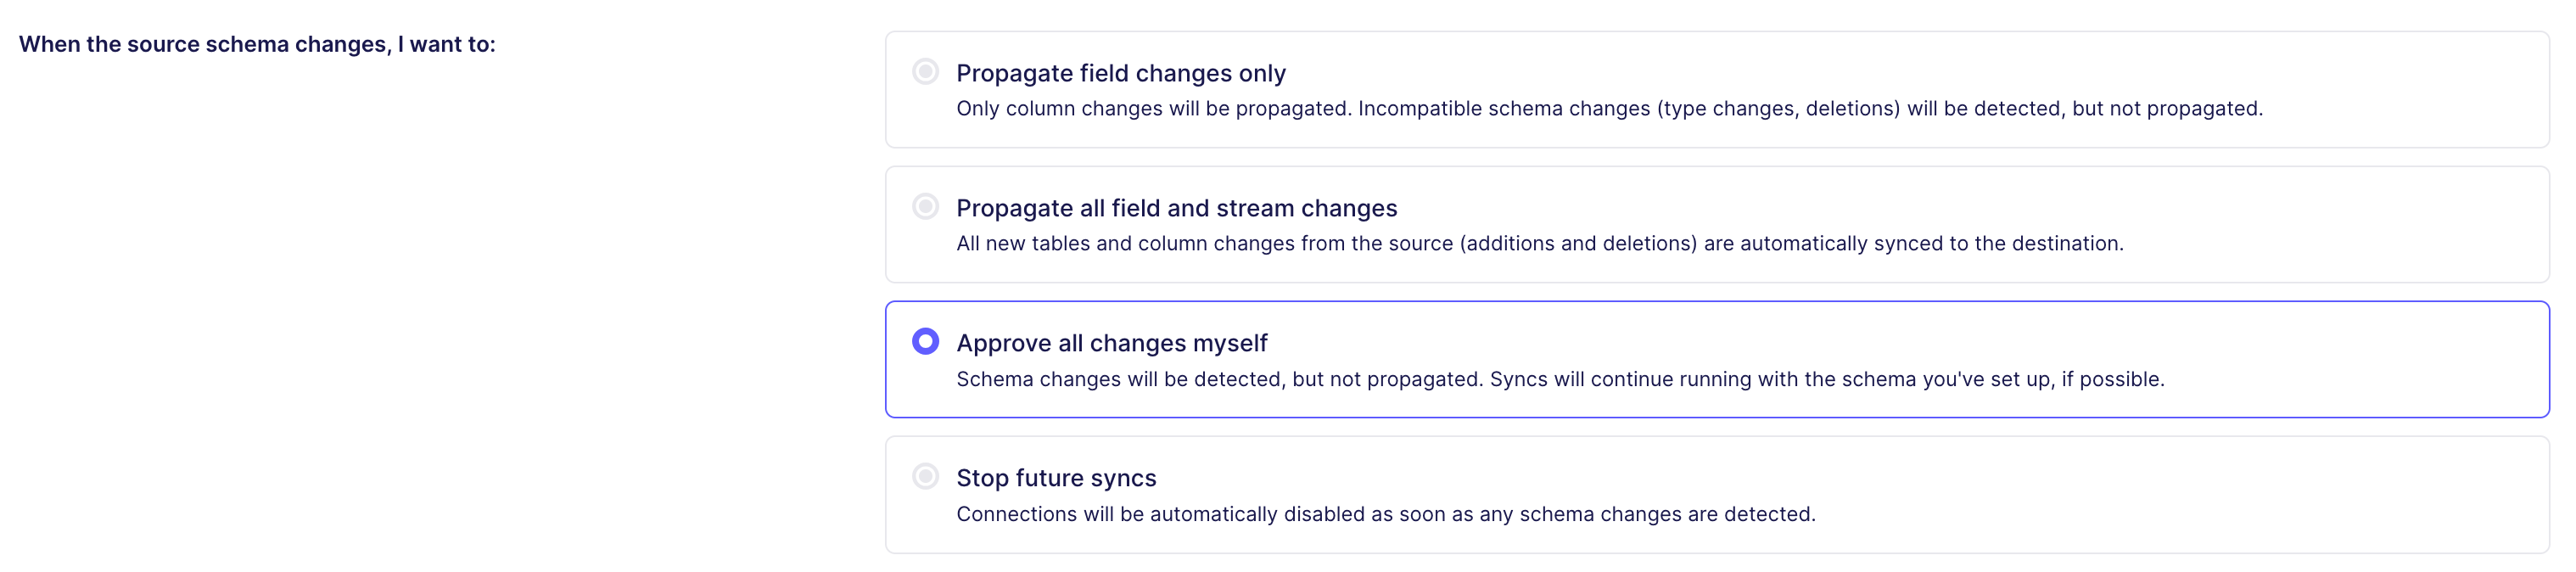
- This might depend on many things, like the data team’s relationship with engineering
- Setting this to manual allows you to test and change the models downstream instead of Airbyte doing this automatically and breaking something unexpectantly
- Once you see that your sync ran successfully, go to Snowflake to confirm that the data landed in the correct schema and format as expected
Orchestration
Misc
- If you anticipate or see your cron jobs growing, get an ochestration tool sooner rather than later. Complexity and maintenance of manual cron scheduling can get out control quickly.
- See article >> “1. Build a Custom Scheduling System” for a good description of what will likely happen.
- Comparisons
Airflow
- Webpage
- Open-source platform for authoring, scheduling, and executing data pipelines.
- Features for managing and monitoring data pipelines, including integration with various data storage and processing technologies. Similar to the Unix cron utility — you write scripts and schedule them to run every X minutes.
- Airflow can be used for any sort of scheduling task, but is often used for scheduling data modeling.
- schedule, run and monitor the refresh of our data warehouse
- Monitoring on-prem
- Checking Airflow logs is not user-friendly (better in AWS MWAA)
- Different types of logs for task, web server, scheduler, worker, and DAGs
- Have to SSH into the server and run commands which becomes more complicated when you want to use distributed servers for scalability.
- Requires you to create a central logging storage and make additional setup to make all servers write logs into that single place
- Server-based
- Remains active even when not running jobs \(\rightarrow\) continually incurring cost
- No latency since servers are always running
- Problems
- Long feedback loop
- While programming, instant feedback of your DAG becomes crucial when you want a sanity check before your code goes too far.
- To see the graph view, which is mainly for visualizing dependencies in DAGs, your code needs to be in the folder of an Airflow scheduler that can be picked up. The airflow scheduler also takes time to render and parse your DAG until it shows up.
- Makes debugging difficult during the development cycle, so some engineers write more lines of code and test them all together. If the lines of code become unmanageable on one screen, you might vaguely remember what to validate and what dependencies to check.
- Difficult with local development
- A docker image can be used to inject as much production-related information as possible. But it’s still not 100% copy, and it takes tremendous effort to develop and maintain that docker image.
- Even if you set up dev, staging, and production environments for running Airflow, they aren’t totally isolated and developers can end-up interfering with one another.
- Services/Extensions
- Astronomer offers a managed Airflow service.
- Amazon Managed Workflows for Apache Airflow (MWAA)
- Managed Airflow service
- Orchestrate jobs in EMR, Athena, S3, or Redshift
- Glue
- Airflow has the glue operator
- CloudFormation can be used to configure and manage
- Glue
- Allows for autoscaling which saves on costs by scaling down when usage is low
- Still needs a server running even when not running jobs
- Monitoring much easier since all the logs are written into CloudWatch
- Ssearch certain logs using Logs Insights
- Have a dashboard that displays usage of server resources like CPU, memory, and network traffic.
- Monitor numerous other Airflow-specific metrics.
- Set up alerts and manage notification recipients programmatically.
- Cost factors
- Instance size
- Additional worker instance
- Additional scheduler instance
- Meta database storage
- Potential Issues:
- Resources are shared on multiple jobs so performance can suffer if:
- Don’t distribute trigger times evenly
- Misconfigure your maximum worker count
- Resources are shared on multiple jobs so performance can suffer if:
- Operate through AWS SDK
- Can
- Create, update, and delete MWAA environments and retrieve their environment information that includes logging policies, number of workers, schedulers
- Run Airflow’s internal commands to control DAGs
- Can’t
- Some of Airflow’s native commands like backfill (check this AWS document), dags list, dags list-runs, dags next-execution, and more
- Can
- DAGs
A DAG pictures a process that has, unlike a cycle, a clear start and ending. DAGs can be one-dimensional and fully sequential, but they can also run tasks in parallel.
Operators:
BashOperatorto execute Bash commands, but Airflow provides plenty of other operators from itsPythonOperator, to Docker or Kubernetes operators.- Such operators also allow executing tasks on remote machine or clusters, not solely the machine or container that serves Airflow itself.
Example: (basic) Sequential bash commands (source)
from datetime import datetime, timedelta from airflow import DAG # Operators; we need this to operate! import BashOperator with DAG( default_args={ "depends_on_past": False, "email": ["airflow-admin@your-site.com"], "email_on_failure": False, "email_on_retry": False, "retries": 1, "retry_delay": timedelta(minutes=5) }, description="Bash Operator" schedule='5 11 * * *', start_date=datetime(2023, 1, 1), catchup=False, tags=["example"], ) as dag: # t1, t2 and t3 are examples of tasks # created by instantiating operators t1 = BashOperator( task_id="print_date", bash_command="date > date.txt", ) t2 = BashOperator( task_id="sleep", depends_on_past=False, bash_command="sleep 5", retries=3, ) t3 = BashOperator( task_id="2 dates", depends_on_past=False, bash_command="cat date.txt & date", ) t1 >> t2 >> t3- Three strictly sequential tasks: Task t1 depends on tasks t2 and t3.
BashOperatoris used to execute Bash commands
- Long feedback loop
AWS Glue
- Cloud-based data integration service that makes it easy to move data between data stores.
- Includes a data catalog for storing metadata about data sources and targets, as well as a ETL (extract, transform, and load) engine for transforming and moving data.
- Integrates with other AWS services, such as S3 and Redshift, making it a convenient choice for users of the AWS ecosystem.
- Serverless (i.e. costs only incurred when triggered by event)
- Each job triggers separate resources, so if one job overloads resources, it doesn’t affect other jobs
- Jobs experience latency since instances have to spin-up and install packages
- Cost
- Charged by Data Processing Unit (DPU) multiplied by usage hours (Pricing)
- Job types:
- Python shell: you can choose either 0.0625 or 1 DPU.
- Apache Spark: you can use 2 to 100 DPUs.
- Spark Streaming: you can use 2 DPUs to 100 DPUs.
- Can run Spark
- Expensive for longer running ETL tasks. So, setting up your own container and deploying it on ECS with Fargate makes sense, both in terms of efficiency and cost.
- Monitoring
- Cloudwatch
- GlueStudio within Glue
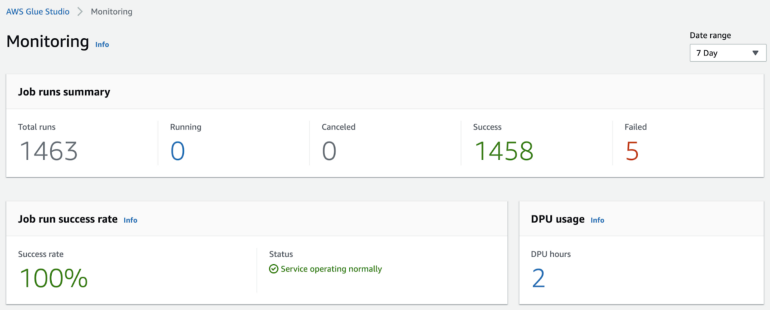
- Clicking number sends you to Cloudwatch where you can drill down into jobs
- CloudFormation can be used to configure and manage
- Glue SDK available
Prefect
- Easier to manage for smaller data engineer teams or a single data engineer
- More user friendly than Airflow; Better UI; more easily discover location and time of errors
- Purely python
- Misc
- Add slack webhook for notifications
- Has slack channel to get immediate help with issues or questions
- Automatic versioning for every flow, within every project
- Also document the models deployed with each version in the README they provide with every flow
- Components
- Tasks - individual jobs that do one unit of work
- e.g. a step that syncs Fivetran data or runs a dbt model
- Flows - Functions that consist of a bunch of smaller tasks, or units of work, that depend on one another
e.g. 1 flow could be multiple tasks running Fivetran syncs and dbt models
Example:
from prefect import flow, task
@flow(name="Create a Report for Google Trends")
def create_pytrends_report(
    keyword: str = "COVID", start_date: str = "2020-01-01", num_countries: int = 10
):
- Tasks - individual jobs that do one unit of work
- These flows are then scheduled and run by whatever types of agents you choose to set up.
- Some options include AWS ECS, GCP Vertex, Kubernetes, locally, etc.
- Deployments (docs)
Also see Create Robust Data Pipelines with Prefect, Docker, and GitHub
Defintions
- Specify the execution environment infrastructure for the flow run
- Specify how your flow code is stored and retrieved by Prefect agents
- Create flow runs with custom parameters from the UI
- Create a schedule to run the flow
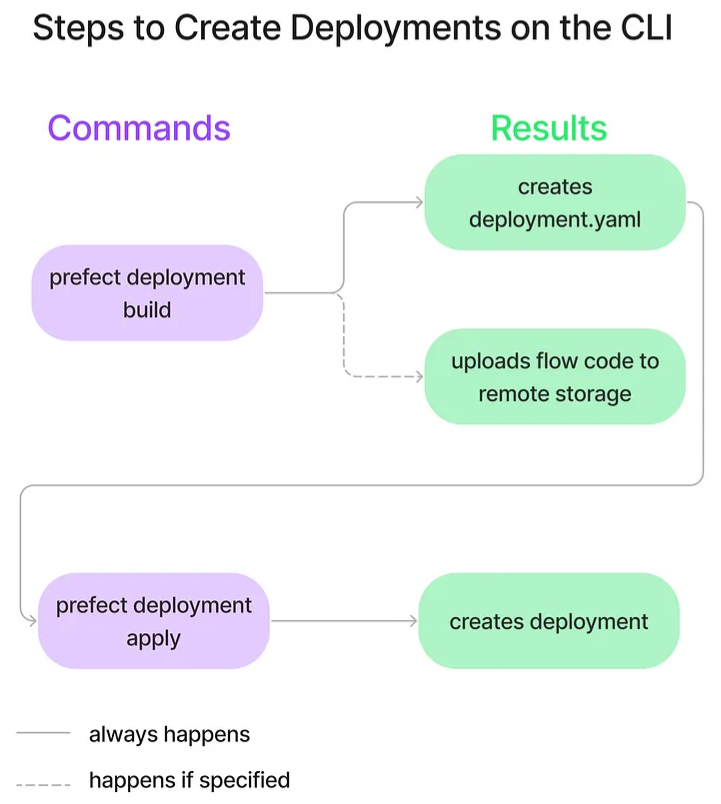
Steps
- Build the deployment definition file and optionally upload your flow to the specified remote storage location
- Create the deployment by applying the deployment definition
Syntax:
prefect deployment build [OPTIONS] <path-to-your-flow>:<flow-name>Example:
prefect deployment build src/main.py:create_pytrends_report \ -n google-trends-gh-docker \ -q test- Deployment for the flow
create_pytrends_report(see flow example) from the file, “src/main.py” -n google-trends-gh-dockerspecifies the name of the deployment to begoogle-trends-gh-docker.-q testspecifies the work queue to betest. A work queue organizes deployments into queues for execution.- Output
- “create_pytrends_report-deployment.yaml” file and a “.prefectignore” created in the current directory.
- “create_pytrends_report-deployment.yaml”: Specifies where a flow’s code is stored and how a flow should be run.
- “.prefectignore”: Prevents certain files or directories from being uploaded to the configured storage location.
- “create_pytrends_report-deployment.yaml” file and a “.prefectignore” created in the current directory.
- Deployment for the flow
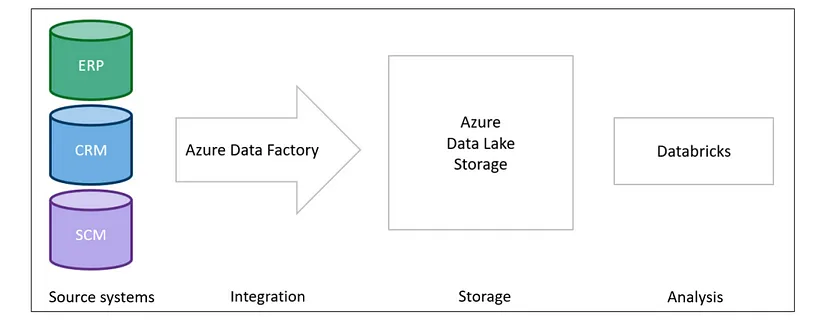
Azure Data Factory
- Allows users to create, schedule, and orchestrate data pipelines for moving and transforming data from various sources to destinations.
- Data Factory provides a visual designer for building pipelines, as well as a range of connectors for integrating with various data stores and processing technologies.
- Example: Demand Planning Project
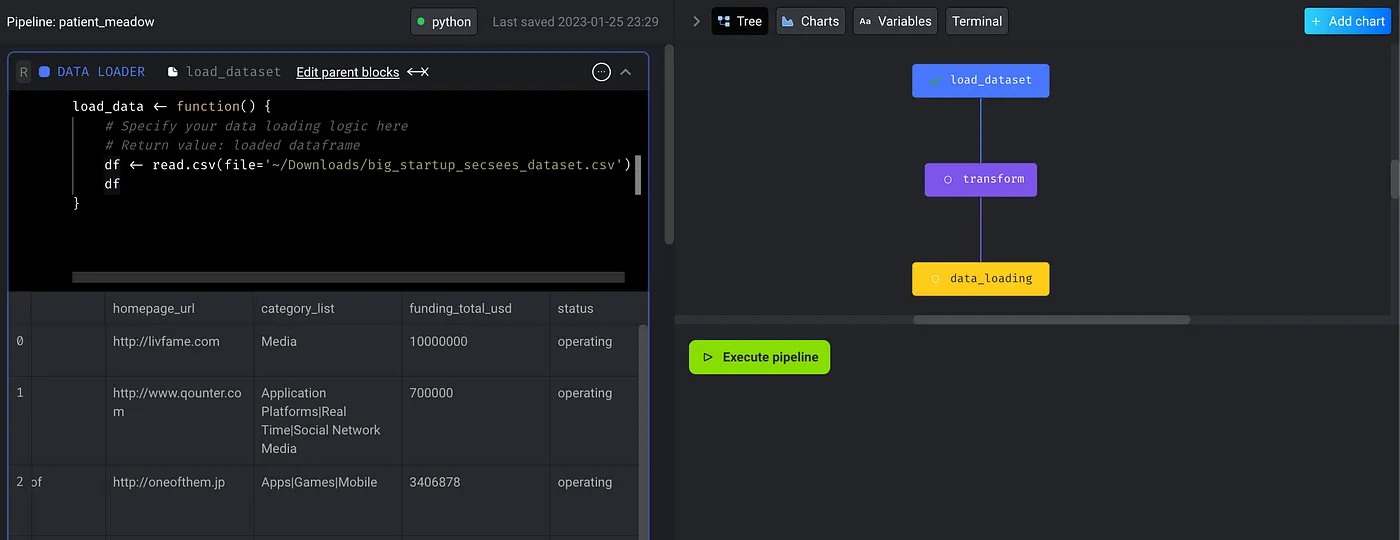
Mage-AI
- Enables users to define DAG regardless of the choice of languages (python/SQL/R)
- Web-based IDE, so its mobility allows working from different devices, and sharing becomes more straightforward.
- UI layout feels like using RStudio. It has many sections divided into different areas.
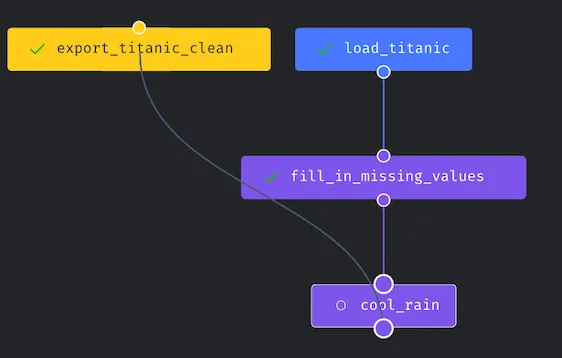
- One of the areas is the DAG visualization which provides instant feedback to the user on the task relationship.
- DAGs
- The pipeline or DAG is constructed with modular blocks—a block maps to a single file.
- Block Options
- Execution with upstream blocks: this triggers all upstream blocks to get the data ready for the current block to run
- Execute and run tests defined in the current block: this focuses on the current block to perform testing.
- Set block as dynamic: this changes the block type into the dynamic block, and it fits better to create multiple downstream blocks at runtime.
- Manipulate dependencies via drag and drop
- Mage-AI keeps track of the UI changes the user made and automatically builds the dependencies DAG into the YAML file (
./pipelines/{your_awesome_pipeline_name}/metadata.yaml)
- Mage-AI keeps track of the UI changes the user made and automatically builds the dependencies DAG into the YAML file (
- Visualize data in each block
- Helpful for inspecting your input data and further validating the transformation.
- Once the chart has been created, it will also be attached to the current block as the downstream_blocks.
- R
- Allows users to write the main ETL (Extraction, Transformation, and Loading) blocks using R.
kestra
- Popular orchestration libraries such as Airflow, Prefect, and Dagster require modifications to the Python code to use their functionalities. You may need to modify the data science code to add orchestration logic
- Kestra, an open-source library, allows you to develop your Python scripts independently and then seamlessly incorporate them into data workflows using YAML files.
Dagster
- Website, Dagster University, Basic Python ML Example, Dagster Claude Skills
- Interface with R
- Dagster Pipes
- Pass logs between an external R session and Dagster
- Pass environment variables and context between an external R session and Dagster
- Asset checks defined in R
- In-memory data passing
- Pass markdown metadata between R and Dagster (e.g.
head()of a data.frame))
- Docker Container Op
- Execute external R code from a Docker container op.
- Utilizing {pins} (Thread)
- See Databases, Lakes >> Misc >> Tools >> {pins}
- Dagster Pipes
ELT/ETL Operations
Misc
- dbt - see DB, dbt
- Google Dataform - Docs, Best Practices
- Census
- Hightouch
- Regarding ELT code in BI tools (Madison Mae)
- Core business logic is written within BI tools to die. Once it is defined in this layer, likely, it will never make it out. It’s hard to access and even more difficult to update.
- When business logic is written within BI tools, it:
- Prevents a source of truth
- Creates “lagging” logic (some metric calculations will contain old logic while others contain new)
- Lacks proper documentation to understand what metrics and fields mean
- Lacks standardization in naming conventions, coding styles, etc.
- Storing logic within BI isn’t scalable or sustainable. Once you reach a certain size, you have no choice but to adopt a better way of doing things. You need to be more strategic in how you choose to organize and write your data models.
- “Shifting left” refers to the idea that you should push your business logic and calculations as far upstream as possible.
- Rather than your core logic living in your BI tool, it would live in a tool like dbt. This way, it is no longer trapped in a spot at the very end of the data pipeline, but exists in the middle, ready to be used by all kinds of tools and platforms.
AWS DataBrew
- Features to clean and transform the data to ready it for further processing or feeding to machine learning models
- No coding; pay for what you use; scales automatically
- Over 250 transformations
- Allows you to add custom transformations with lambda functions
Databricks Lakeflow
- Components
- LakeFlow Connect - Provides the connectors between the different data sources and the Databricks service
- Currently “supports SQL Server, Salesforce, Workday, ServiceNow and Google Analytics, with MySQL and Postgres following very soon”
- Flow Pipelines - A version of Databricks’ existing Delta Live Tables framework for implementing data transformation and ETL in either SQL or Python
- Offers a low-latency mode for enabling data delivery and can also offer incremental data processing so that for most use cases, only changes to the original data have to get synced with Databricks
- LakeFlow Jobs - Provides automated orchestration and ensures data health and delivery
- e.g orchestrates updating a dashboard or training a ML model on these data.
- LakeFlow Connect - Provides the connectors between the different data sources and the Databricks service
Model Experimentation/Version Tracking
DVC
- Tracks data and models while model building
- Store code and track changes in a Git repository while data/models are in AWS/GCP/Azure/etc. storage
- Tracking changes
- Steps
- hashes every file in the directory data,
- adds it to .gitignore and
- creates a small file data.dvc that is added to Git.
- By comparing hashes, DVC knows when files change and which version to restore.
- Steps
- Initial Steps
- Goto project directory -
cd <path to local github repo> - Initialize DVC -
dvc init - Add a data path/uri -
dvc remote add -d remote path/to/remote- can be Google Drive, Amazon S3, Google Cloud Storage, Azure Storage, or on your local machine
- e.g. Google Drive:
dvc remote add -d remote gdrive://<hash>- The hash will the last part of the URL, e.g. “https://drive.google.com/drive/u/0/folders/1v1cBGN9vS9NT6-t6QhJG”
- Confirm data set-up:
dvc config -l- The config file is located inside “.dvc/”
- To version your config on github:
git add .dvc/config
- Add data/ to .gitignore
- Example showed adding every file in the repo manually but this seems easier
- Add, commit, and push all files to repo
- Main differences to regular project initialization
- data/ directory doesn’t get pushed to github
- data.dvc file gets pushed to github
- Main differences to regular project initialization
- Set-up DVC data cache
Can be local directory/s3/gs/gdrive/etc
Example: S3
dvc remote add -d myremote s3://mybucket/path git add .dvc/config git commit -m "Configure remote storage" git push dvc push- I’m guessing .dvc/config is created with
dvc remote addand wasn’t there before. Otherwise in steps 3 and 4, I need to add the files manually.
- I’m guessing .dvc/config is created with
- Goto project directory -
Model/Data Drift Monitoring
- Arize AI
- Docs
- Accessed through Rest API, Python SDK, or Cloud Storage Bucket
- Fiddler AI Monitoring: fiddler.ai has a suite of tools that help in making the AI explainable, aid in operating ML models in production, monitor ML models and yes data & model drift detection is one of them
- Evidently: EvidentlyAI is another open-source tool, which helps in evaluating and monitoring models in production. If you are not using Azure ML and looking for a non-commercial tool that is simple to use, evidentlyai is a good place to start.
- Azure ML
- Monitors data; uses wasserstein distance
- AWS Glue DataBrew
- Monitors features
- Calculates full suite of summary stats + entropy
- Can be exported to a bucket and then download to measure change over time
- Accessed through console or programmatically
- Generates reports that can be viewed in console or be exported in html, pdf, etc.
App/Cluster Monitoring
Misc
- Sampler - Alternative to Prometheus + Graphana. A tool for shell commands execution, visualization and alerting. Configured with a simple YAML file.
- Sample any dynamic process right from the terminal — observe changes in the database, monitor MQ in-flight messages, trigger a deployment script and get notification when it’s done.
- No servers, no databases, no deploy - you specify shell commands, and it just works
- Can run Sampler on local, but still gather telemetry from multiple remote machines
- Visualization Types
- Runcharts display time-series data with optional legends and statistics, ideal for tracking response times or resource usage over time.
- Sparklines provide compact line graphs perfect for monitoring system metrics like CPU usage.
- Barcharts excel at comparing multiple values simultaneously, such as network traffic across different protocols.
- Gauges show progress or completion metrics with customizable min/max values.
- Textboxes display raw command output, useful for logs or status information.
- Asciiboxes render large text in various styles, commonly used for clocks or prominent metrics.
Graphana
- An open-source monitoring and observability system that provides powerful visualization capabilities for analyzing and understanding data from various sources, including cloud services
- Github
- Cost Optimization
- Visualize Cloud Costs: Integrate Grafana with cloud providers (AWS, Azure, GCP) to ingest cost data. Create custom dashboards that display cost metrics like hourly, daily, or monthly spending by service, project, or region. Utilize heatmaps and other visualizations to identify cost spikes, trends, and anomalies.
- Drill Down for Insights: Grafana allows you to drill down into specific cost components, such as CPU, storage, network usage, or database instances. Correlate cost data with other infrastructure metrics (e.g., CPU utilization) to understand the root cause of cost variations. This helps you identify idle resources or inefficient configurations that are driving up costs.
- Set Cost Alerts: Configure alerts that trigger when spending exceeds predefined thresholds or when anomalous cost patterns arise. Early detection of potential overspending allows you to take corrective actions, such as scaling down resources or optimizing configurations.
- Ready to use dashboards
- Amazon Managed Grafana for Cost Anomaly Detection
- Kubernetes Dashboard for cost management
Prometheus
- Designed to work as a monitoring and alerting toolkit, especially for cloud-native platforms. It collects and analyzes the metrics from your cloud infrastructure
- Misc
- Github
- Prometheus is not a time series database (TSDB). It merely leverages a TSDB.
- Because Prometheus scrapes values periodically, some Metric types (e.g., Gauges) can lose precision if the Metric value changes more frequently than the scraping interval. This problem does not apply to monotonically increasing metrics (e.g., Counters).
- Metrics can be logged with arbitrary identifiers such that at query time, users can filter Metrics by their identifier value.
- PromQL is flexible – users can compute many different aggregations (basic arithmetic functions) of Metric values over different window sizes, and these parameters can be specified at query time.
- Usage for Cost Optimization
- Resource Consumption Insights: With the help of this tool, the user can understand how efficiently our resources are being utilized by taking into consideration different metrics like CPU, memory, and storage usage for cloud resources.
- Identifying Idle Resources: Another feature of using Prometheus is that we can easily identify resources with consistently low utilization rates, indicating potential overprovisioning.
- Cost Correlation: Combine Prometheus metrics with cost data from your cloud provider. This correlation can help you understand which resources are driving up costs and how changes in resource usage affect your cloud bill.
- Metric values (Docs):
- Counter: a cumulative Metric that monotonically increases. Can be used to track the number of predictions served, for example.
- Gauge: a Metric that represents a single numerical value that can arbitrarily change. Can be used to track current memory usage, for example.
- Histogram: a Metric that categorizes observed numerical values into user-predefined buckets. This has a high server-side cost because the server calculates quantiles at query time.
- Summary: a Metric that tracks a user-predefined quantile over a sliding time window. This has a lower server-side cost because quantiles are configured and tracked at logging time. Also, the Summary Metric doesn’t generally support aggregations in queries.
- Process
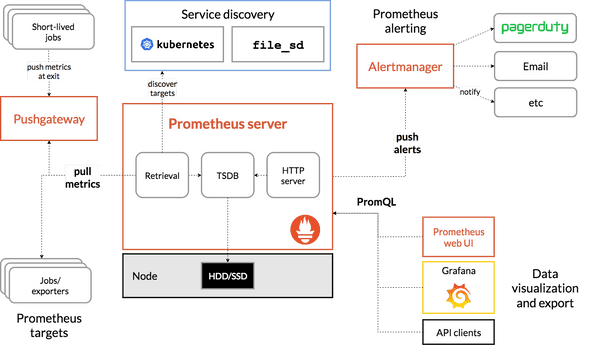
- Users instrument their application code to log Metric values.
- Those values are scraped and stored in a Prometheus server.
- The values can be queried using PromQL and exported to a visualization tool like Grafana
- The are R packages that might make querying these metrics easier so you don’t have to learn PromQL
- Don’t use for ML monitoring (article)
- Need to use multiple Prometheus Metric types for cross-component monitoring
- Need to define histogram buckets up front for single-component monitoring
- Correctness of query results depending on scraping interval
- Inability to handle sliding windows
- Disgusting-looking PromQL queries
- High latency for cross-component metrics (i.e., high-cardinality joins)
Cloud Services Managment
- Terraform
Not open source
Provision infrastructure across 300+ public clouds and services using a single workflow through yaml files
- Automates and makes these workflows reproducible
- Article on using it with R
Benefits
- Infrastructure Optimization:
- Resource Visibility: Terraform provides a clear overview of your entire infrastructure, making it easier to identify and eliminate unused or underutilized resources.
- Right-Sizing: You can define resource configurations with the exact specifications your applications require, preventing overprovisioning.
- Reduced Errors & Faster Configuration: With Terraform, you can automate the whole process, minimizing costly mistakes. Also, the infrastructure changes are applied quickly and consistently through code which saves time and reduces errors.
- Cloud Cost Management: This tool integration in your application can also provide the early cost estimation of infrastructure based on your configurations. This allows you to make informed decisions about resource types and sizes before provisioning. Not only this, automated checks can also be applied to set it within the budget limits.
- Infrastructure Optimization:
Example: Enable a couple of cloud APIs and name an Artifact Registry which is eventually where we will push a docker image of our app. (Article, Code).
The main terraform file. It lists the Google services being used, gives them names, and enables them.
terraform { required_version = ">=1.5" backend "local" {} required_providers { google = { source = "hashicorp/google" } } } provider "google" { project = var.project_id region = var.region credentials = file("secrets/google_key.json") } # Artifact registry for containers resource "google_artifact_registry_repository" "deploy-api-container-registry" { location = var.region repository_id = var.registry_id format = "DOCKER" } variable "gcp_service_list" { description ="The list of apis necessary for the project" type = list(string) default = [ "artifactregistry.googleapis.com", "run.googleapis.com" ] } resource "google_project_service" "gcp_services" { for_each = toset(var.gcp_service_list) project = var.project_id service = each.key }- Blocks
- Terraform metadata
- Provider region and project information
- A block representing the container registry API
- The last two blocks are code that enables the registry and cloud run APIs
- Don’t have to worry about the fact that the blocks enabling APIs come after the blocks creating new resources under specific APIs
variable "project_id" { type= string description = "GCS project ID" } variable "region" { type = string description = "Region for GCP resources" default = "europe-west6" } variable "registry_id" { type = string description = "Name of artifact registry repository." }- Provides meta-data on the variables needed in your project
# GCP settings project_id = "YOUR PROJECT ID" region = "YOUR REGION" # Artifact registry registry_id = "YOUR ARTIFACT REGISTRY NAME"- Put the actual names of your Google Cloud Project variables but do NOT make public.
- There should be an entry in this file for every variable in the
variables.tffile.
- 1
- If successful, you should see a message saying “Terraform has been successfully initialized!”.
- 2
-
Will think through what you’ve asked for in
main.tf. - 3
- Creates the GCP resources. If successful, you will see a message saying: “Apply complete! Resources: 3 added, 0 changed, 0 destroyed.”
- Blocks
- Datadog - Monitor servers in all cloud hosts in one place — alerts, metrics, logs, traces, security incidents, etc.
- OpenTofu
- A fork of Terraform that is open-source, community-driven, and managed by the Linux Foundation
Other
- PagerDuty - Automated incident management — alerts, notifications, diagnostics, logging, etc.