Modeling
Misc
- Used to organize data warehouses
- Notes from
- Packages
- Resources
- Using DuckDB-WASM for in-browser Data Engineering has a complete example that builds a snowflake schema with SQL code.
- Naming Conventions
- Prefix dimension tables with dim_
- Prefix fact tables with fact_
- In general, avoid using abbreviations that might sound misleading (e.g. stg_, int_) and use full English words in database object names where possible.
- Abbreviate common terms to a minimum of three letters for visibility and better discovery mainly, e.g. dev for development, prod for production, etc.
- Most of the modern data warehouse (DWH) solutions support 20–30 character names for identifiers. Postgres even supports more.
- Use the singular form for names when possible — for example, _transaction not _transactions
- Use lower_snake_case with no quotes around database identifier
- Server-side development, e.g. existing implementations of event streams, connectors, SDK wrappers, etc. — might rely heavily on names in legacy databases. So, obviously refactoring is not worth the risk in such a case.
Terms
- Data Modeling - A process of creating a conceptual representation of the data and its relationships within an organization or system.
- Dimensional Modeling - A data modeling technique that attempts to present data in a way that is intuitive and understandable for any user. It also allows for high-performance access, flexibility, and scalability to accommodate changes in business needs.
- It consists of one or more tables with a multipart key, referred to as the fact table, along with a set of tables known as dimension tables
- Dimension Tables - Contains data about how the data in Fact Table is being analyzed. They facilitate the fact table in gathering different dimensions on the measures which are to be taken.
- Provides descriptive attributes for the fact table data. Think of them as adding context and details to the “what” and “how much”. Each dimension table focuses on a specific category of information.
- Can contain hierarchical structures, e.g. an employee dimension table with an employee id field and a manager id field. Each manager id may have many employee ids associated with it.
- Primary keys are foreign keys in Fact Tables.
- Dimension Tables rarely change from day to day within a business while Fact Tables are always changing
- Types
- Conformed Dimension - A dimension that can be used by multiple fact tables. For example, a region table can be utilized by different fact tables.
- Degenerate Dimension - Occurs when an attribute is stored in the fact table instead of a dimension table.
- Example: The transaction number can be found in a fact table.
- Junk Dimension - Contains non-meaningful attributes that do not fit well in existing dimension tables, or they are combinations of flags and binary values representing various combinations of states.
- Role-Playing Dimension - The same dimension key includes more than one foreign key in the fact table.
- Example: A date dimension can refer to different dates in a fact table, such as creation date, order date, and delivery date.
- Static Dimension - A dimension that typically never changes. It can be loaded from reference data without requiring updates.
- Example: A list of branches in a company
- Bridge Table - Used when there are one-to-many relationships between a fact table and a dimension table
- Example: An online retail store wants to analyze sales data.
- Customer Dimension - Provides information about individual customers, like their name and location. The customer id field is the primary key that links it back to the fact table.
- Product Dimension - Describes each product, including its category, brand, and other relevant details. The product id field is the primary key that links it back to the fact table.
- Provides descriptive attributes for the fact table data. Think of them as adding context and details to the “what” and “how much”. Each dimension table focuses on a specific category of information.
- Fact Tables - Contain data corresponding to any business process like a customer transaction. Every row represents any event that can be associated with any process. It stores quantitative information for analysis, i.e. the metrics or measures associated with that event.
- Focuses on quantitative data representing business events or transactions. Think of it as storing the “what” and “how much” of your data.
- Foreign keys link to Dimension Tables.
- The best practice is to put all foreign keys on the top of the table followed by the measures
- Types
- Transaction Fact Tables - One row represents a record from the transaction system. Data is refreshed on a daily basis or in real time.
- Periodic Snapshot Fact Tables - Captures a snapshot of a fact table at a point in time, like for instance the end of month.
- Accumulating Snapshot Fact Table - Summarizes the measurement events occurring at predictable steps between the beginning and the end of a process.
- Factless Fact Table - Keeps information about events occurring without any measures or metrics.
- Example: An online retail store wants to analyze sales data.
- Fields: quantity, price, and total say what products were ordered, by whom, when, and how much they cost.
- Other fields could be sales amounts, quantities sold, customer interactions, website clicks, or any other measurable data that offers insights into business performance.
- An order id would be the primary key. and the table would also contain the foreign keys for all the dimension tables (e.g product id and customer id) associated with it.
- Fields: quantity, price, and total say what products were ordered, by whom, when, and how much they cost.
- Natural Key - A primary key that is innate to the data.
- Perhaps, in some tables, there’s a unique id field in each table that would act as the natural key.
- You can use documentation like entity relationship diagrams (ERDs) to help understand natural keys in APIs or backend application database tables.
- Surrogate keys are better if you think there’s a remote chance of a future problem with the natural key. Natural keys have a tendency to cause problems when scaling the data model, and they also can deteriorate over time becoming meaningless.
- A good example can be a stock price ticker after an M&A or a company reorganisation (GOOG/GOOGL, etc.).
- Slowly Changing Dimensions (SCD) - Data records that slowly change over time, e.g. email, address, and phone number. Types depend on how changes are tracked in your database. These can affect the types of analyses that are possible. For example, you won’t be able to track historical price changes of a product over time if you just now realize the product pricing data is a Type 1. Type 2 seems best here, but you need to understand the business need of the table first. If you create a snapshot that never gets used, then that’s a waste of time and resources.
- Type 1 - Overwrites old values in your data. The new value will replace the old value, without any record of what the old value was. I find this is the method used in most databases.
- Used in most databases and the one that causes the most issues for analytics engineers
- You may need to create a snapshot of the source table using a tool like dbt, to ensure you can measure how the data changes over time.
- Type 2 - Inserts new values as new records in your database. They maintain the “old” records AND the new records.
You need to have additional fields on the records that indicate a version number or the timestamps in which the value is effective. So all history is maintained.
- if you are joining orders to customers, you will want to join on both of these fields to find the customer record valid at the time the customer placed their order.
You’ll need to apply a window function to find the most recent value of a record when the data source is used downstream
Example: John Smith moves from London to Chicago
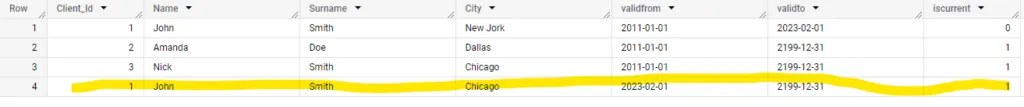
MERGE INTO client AS tgt USING ( SELECT Client_id, Name, Surname, City, GETDATE() AS ValidFrom, ‘2199-01-01’ AS ValidTo FROM client_stg ) AS src ON (tgt.Clinet_id = src.Clinet_id AND tgt.iscurrent = 1) WHEN MATCHED THEN UPDATE SET tgt.iscurrent = 0, ValidTo = GETDATE() WHEN NOT MATCHED THEN INSERT (Client_id, name, Surname, City, ValidFrom, ValidTo, iscurrent) VALUES (Client_id, name, Surname, City, ValidFrom, ValidTo,1);- ValidFrom and ValidTo are the additional fields that indicate the dates that the record is valid
- Type 3 - Maintains one record for the original primary key but utilizes an “original” value field and a “current” value field. They track the previous and current values of a field in one record (Unlike Type 2 which is a separate record).
- However, this means they only track the most recent change in value and not the entire history of changes.
- This would be viable for a field that can only be changed once.
- Type 4 - Use two tables to represent one object. They use a table to store current values, and another table to store historical values.
- The history table contains one timestamp field that you can then use to piece together the chronological history of values.
- Can be inconvenient when working with frequently changing data, as there are various joins required
- Type 1 - Overwrites old values in your data. The new value will replace the old value, without any record of what the old value was. I find this is the method used in most databases.
- Surrogate Keys - A unique key that’s derived from the data itself
- The type of method can impact querying performance
- Methods
- Hashing: Generated using a hash function like MD5, SHA256 (e.g.
md5(key_1, key_2, key_3)).Example
select
    md5(calendar_date || ad_id) as unique_id
- Incrementing: Generated by using a number that is always incrementing (e.g. r
ow_number(),identity). - Concatenating: Generated by concatenating the unique key columns (e.g.
concat(key_1, key_2, key_3)). - Unique generated: Generated by using a function that generates a unique identifier (e.g.
GENERATE_UUID())
- Hashing: Generated using a hash function like MD5, SHA256 (e.g.
- Example: A table with all license plate numbers and the state of the plate (source)
- While license plate numbers are unique to their state, there could be duplicate license plate numbers across different states. So by default, there’s no Natural Key that can uniquely identify each row here.
- In order to uniquely identify each record in this table, you could create a surrogate key based on the unique combination of license plate number and its state.
Schema
- Star
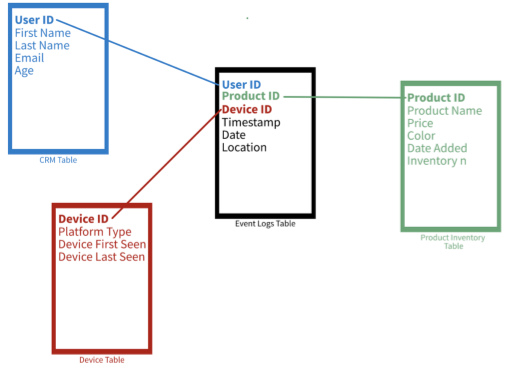
- Example: A Star schema of sales data with dimensions such as customer, product, and Device.
- In a star schema, as the structure of a star, there is one fact table in the middle and a number of associated dimension tables.
- The fact table consists of primary information. It surrounds the smaller dimension lookup tables which will have details for different fact tables. The primary key which is present in each dimension is related to a foreign key which is present in the fact table.
- The fact tables are in 3NF form and the dimension tables are in denormalized form. Every dimension in star schema should be represented by the only one-dimensional table.
- If you encounter challenges with updates to extensive dimension tables, consider transitioning to a snowflake schema.
- Snowflake
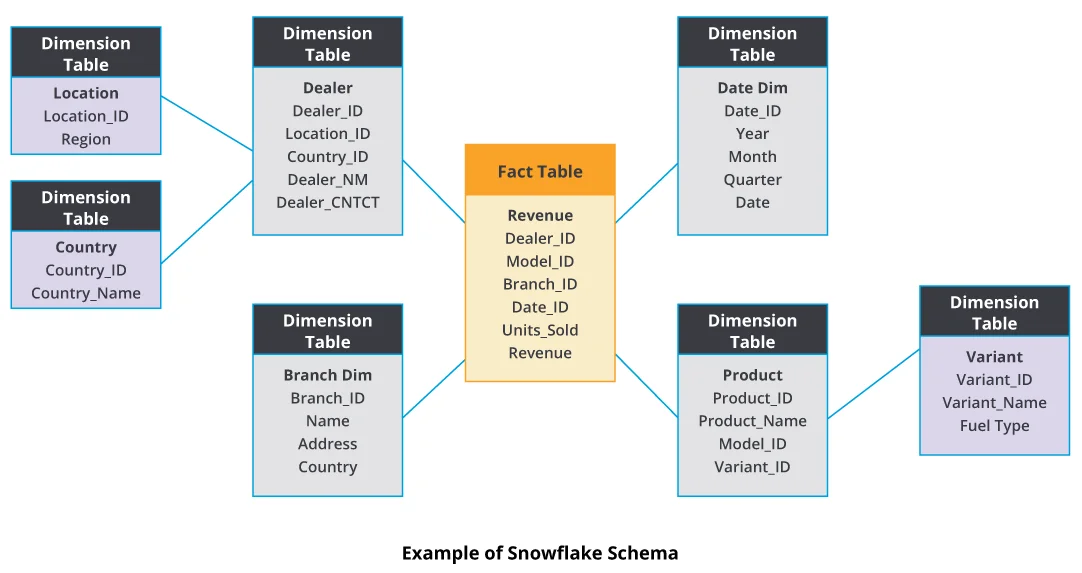
- Snowflake schema acts like an extended version of a star schema. There are additional subdimensions added to dimensions.
- Unlike the Star schema, dimensions are normalized which results in less redundancy.
- Specifically tailored to handle updates on large dimensions
- Can be slower than star schemas due to complex joins across multiple tables, but achieves better storage efficiency compared to star schemas due to reduced data redundancy.
- There are hierarchical relationships and child tables involved that can have multiple parent tables.
- The advantage of snowflake schema is that it uses small disk space. The implementation of dimensions is easy when they are added to this schema.
- Fact Constellation or Galaxy
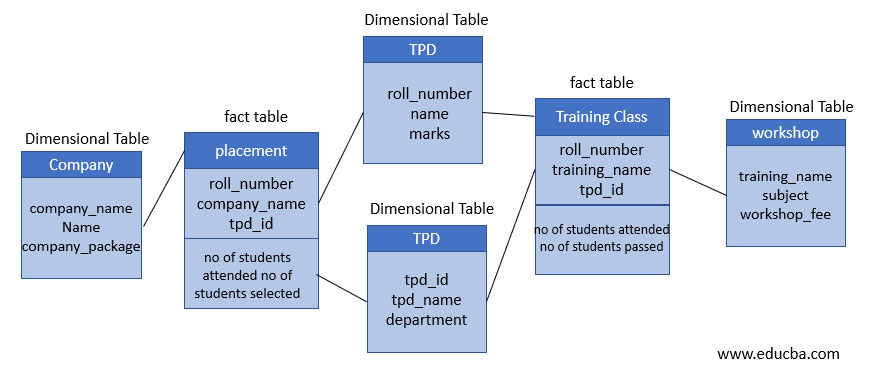
- A fact constellation can consist of multiple fact tables. These are more than two tables that share the same dimension tables — like connected Star schema.
- The shared dimensions in this schema are known as conformed dimensions. Denormalization in shared dimension tables might increase storage size compared to fully normalized schemas.
- Dimensions can be normalized but is rare in this schema due the level of complexity already present.
- Useful when aggregation of fact tables is necessary. Fact constellations are considered to be more complex than star or snowflake schemas. Therefore, more flexible but harder to implement and maintain. Joins across multiple fact and dimension tables can lead to complex queries with potential performance impacts.
Design
Misc
- Resources
- Oracle Data Model Documentation - Docs for Oracle’s solution to creating a retail data warehouse and includes logical and physical models
- Also see Databases, Normalization >> Entity-Relationship (ER) Modeling
- Resources
Considerations
- 7 Vs
- Volume: How big is the incoming data stream and how much storage is needed?
- Velocity: Refers to speed in which the data is generated and how quickly it needs to be accessed.
- Variety: What format the data needs to be stored? Structured such as tables or Unstructured such as text, images, etc.
- Value: What value is derived from storing all the data?
- Veracity:How trustworthy the data source, type and its processing are?
- Viscosity: How the data flows through the stream and what is the resistance and the processability?
- Virality: Ability of the data to be distributed over the networks and its dispersion rate across the users_
- Data Quality (See Database, Engineering >> Data Quality) completeness, uniqueness, timeliness, validity, accuracy, and consistency
- 7 Vs
Components
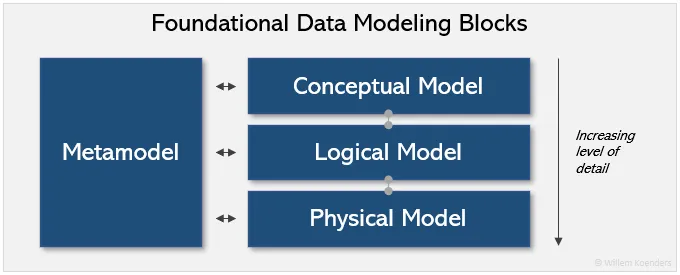
- Metamodeling:
- Defines how the conceptual, logical, and physical models are consistently linked together.
- Provides a standardized way of defining and describing models and their components (i.e. grammar, vocabulary), which helps ensure consistency and clarity in the development and use of these models.
- Data ownership should be assigned based on a mapping of data domains to the business architecture domains (i.e. market tables to the marketing department?)
- Conceptual Modeling - Involves creating business-oriented views of data that capture the major entities, relationships, and attributes involved in particular domains such as Customers, Employees, and Products.
- Logical Modeling - Involves refining the conceptual model by adding more detail, such as specifying data types, keys, and relationships between entities, and by breaking conceptual domains out into logical attributes, such as Customer Name, Employee Name, and Product SKU.
- Physical Data Modeling - Involves translating the logical data model into specific database schemas that can be implemented on a particular technology platform
- Metamodeling:
Process (article, article, article)
- Understand the Core Business Requirements
- Create a catalogue of reporting stories for each stakeholder to an idea of the reports that each will want generated
- These will inform you of the data requirements
- e.g. “As a marketing manager, I need to know the number of products the customer bought last year in order to target them with an upsell offer.”
- From the story above, I can determine that we will need to aggregate the number of products per customer based on sales from the previous year.
- Create a catalogue of reporting stories for each stakeholder to an idea of the reports that each will want generated
- Select the tools and technologies:
- Used to build and manage the data warehouse. This may include selecting a database management system (DBMS), data integration and extraction tools, and analysis and visualization tools.
- Warehouses - See Brands
- See Production, Tools >>
- Choose a data model
- Identify Business Processes
- Focus on business process and not business departments as many departments share the same business process
- e.g. sales, orders, or inventory.
- If we focus on department, we might end up with multiple copies of models and have different sources of truth.
- Focus on business process and not business departments as many departments share the same business process
- Choose a data model from the Business Process
- Start with the most impactful model with the lowest risk
- Consult with the stakeholders
- Should be used frequently and be critical to the business and also it must be built accurately
- Start with the most impactful model with the lowest risk
- Decide on the data granularity
- Most atomic level is the safest choice since all the types of queries is typically unknown
- Need to consider the size and complexity of the data at the various granularities, as well as the resources available/costs for storing and processing it.
- Examples
- Customer Level - Easy to answer questions about individual customers, such as their purchase history or demographic information.
- Transaction Level - Easy to answer questions about individual transactions, such as the products purchased and the total amount spent.
- Daily or Monthly?
- Identify Business Processes
- Create Conceptual Data Models (Tables)
- These represent abstract relationships that are part of your business process.
- Explains at the highest level what respective domains or concepts are, and how they are related.
- The elements within the reporting stories should be consistent with these models
- Example: Retail Sales
- Time, Location, Product, and Customer.
- Time might be used to track sales data over different time periods (e.g. daily, monthly, yearly).
- Location might be used to track sales data by store or region.
- Product might be used to track sales data by product category or specific product.
- Customer might be used to track sales data by customer demographics or customer loyalty status.
- Time, Location, Product, and Customer.
- Example: Retail Sales
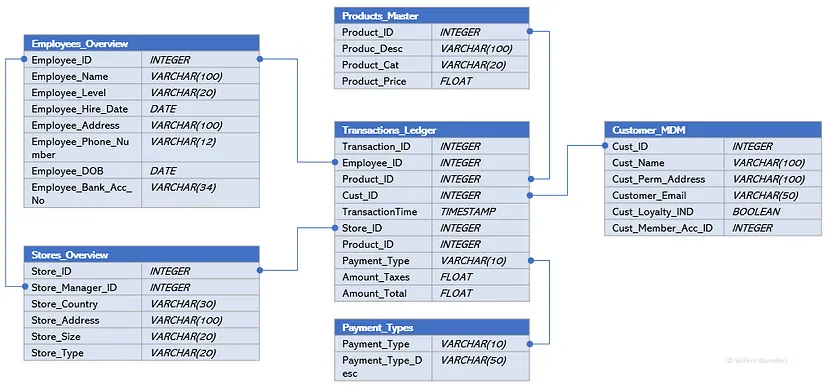
- Example:
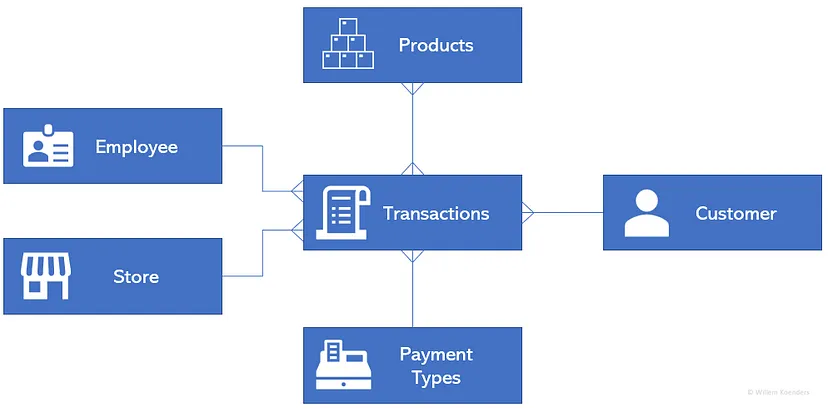
- Transactions form a key concept, where each transaction can be linked to the Products that were sold, the Customer that bought them, the method of Payment, and the Store the purchase was made in — each of which constitute their own concept.
- Connectors show that each individual transaction can have at most one customer, store, or employee associated with it, but these in turn can be associated with many transactions (multi-prong connector into Transactions)
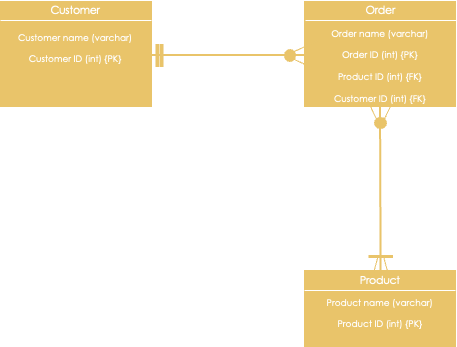
- Example:
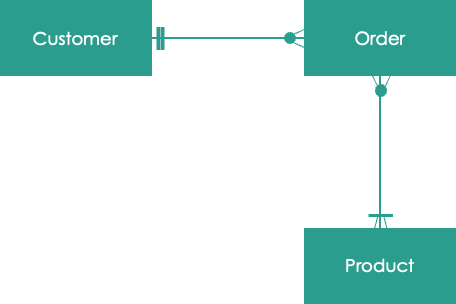
- Each Customer (1 prong connector) can have 0 or more Orders (multi-prong connector)
- Each Order can have 1 or more Products
- Each Product can have 0 or more Orders
- Create Logical Data Models
- Breakdown each entity of the conceptual model into attributes
- Example:
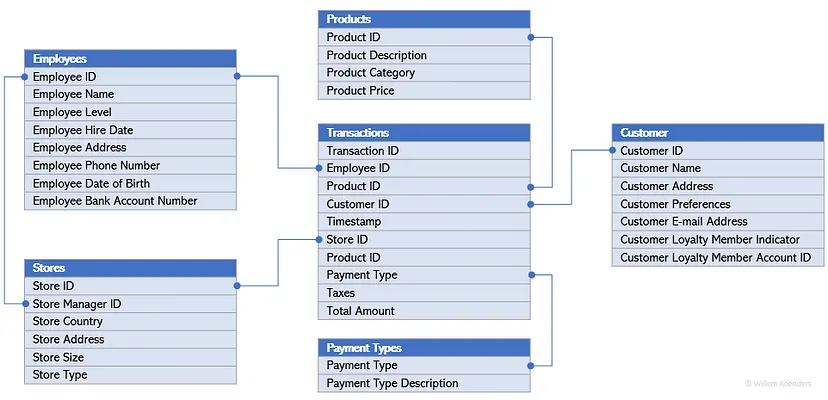
- Example:
- Example:
- Breakdown each entity of the conceptual model into attributes
- Create Physical Data Models
Details are added on where exactly (e.g., in what table), and in what format, these data attributes exist.
- e.g. finalizing table names, column names, data types, indexes, constraints, and other database objects
Translate the logical data model into specific database schemas that can be implemented on a particular technology platform
- e.g. dimensional modelling in a star schema or normalisation in a 3rd normal form in a snowflake model.
Example:
Example: Dimension model in a star schema
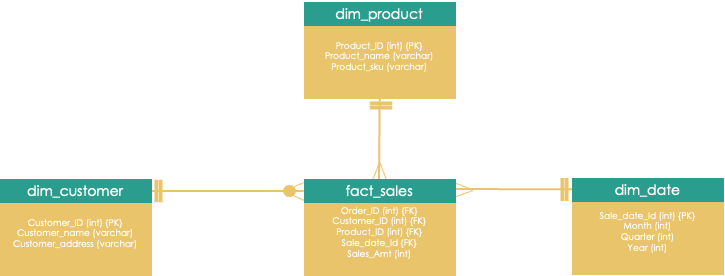
- fact_ (quantitative) and dim_ (qualitative)
- Make Design and Environment decisions
- Decide on:
- Physical data models
- History requirements
- Environment provisions & set up
- Decide on:
- Build a prototype (aka wireframe) of the end product
- The business end-user may have a vision, they couldn’t coherently articulate at the requirement phase.
- The prototype need not use real-world data or be in the reporting tool.
- ** Profile known sources data **
- Learn about the data quality issues, and try and remediate those issues before designing your data pipelines.
- If an issue cannot be resolved, you will have to handle it in your data pipeline
- Learn about the data quality issues, and try and remediate those issues before designing your data pipelines.
- Build, Test, and Iterate
- Create ETL jobs or data pipelines
- Iteratively need to unit test the individual components of the pipeline.
- The data will need to be moved from the source system into our physical warehouse
- Profile data
- Data types, and if conversion is required
- The amount of history that needs to be pulled
- Validate the model’s output numbers with the business end-user
- Create ETL jobs or data pipelines
- Progress towards Data Maturity (See Job, Organizational and Team Development >> Data Maturity)
- Understand the Core Business Requirements