JS
Misc
- Resources
- Online Interactive Cheat Sheet
- Learn Just Enough JavaScript
- Basics: variables, objects, arrays, functions, conditionals, loops
- How to run R code in the browser with webR
- Nice breakdown of generic JS code to run scripts on a webpage
- JavaScript for Data Science
- JavaScript for R
- Tools
- Prettier - Linter for js, html, and css
- hrbmstr: “javascript has the advantage over R/Python for both visualization speed — thanks to GPU integration — and interface creation — thanks to the ubiquity of HTML5 — means that people will increasingly bring their own data to websites for initial exploration first”
console.logis the print method
Basics
Operators
//: comments...: If you want to copy all the values in your array, and add some new ones, you can use the {…} notation.${<code>}: Anything within the${}get ran as codeExample:
`${b.letter}: ${ (b.frequency*100).toFixed(2) }%`- Backticks indicate it’s like a glue string or f string (i.e. uses code)
- b.letter and b.frequency are properties in an array
to.Fixedis a method that rounds the value to to 2 decimal places- This was an example of a tooltip, so output would look like “F: 12.23%”
Variables
myNumber = 10 * 1000 variableSetToCodeBlock = { const today = new Date(); return today.getFullYear() }Object:
myObject = ({name: "Paul", age: 25})- Contained within curly braces, { }
- Subset property, name:
myObject.namewhich returns value, PaulmyObject["name"]which is useful if you have spaces, etc. in your property names
- Types
Arrays
List of objects
- Contained within brackets, [ ]
- Each row is an object and each column is a property of that object and that property has a value associated with it
Basic examples
myArray = [1, 2, 3, 4]
myArray = [[1, 2], [3, 4]] // arrays within arrays
myArray = [1, 'cat', {name: 'kitty'}] // objects within arrays
DF-like array
myData = [
  {name: 'Paul', city: 'Denver'},
  {name: 'Robert', city: 'Denver'},
  {name: 'Ian', city: 'Boston'},
  {name: 'Cobus', city: 'Boston'},
  {name: 'Ayodele', city: 'New York'},
  {name: 'Mike', city: 'New York'},
]
Equivalent Functions: Traditional vs Arrow
// traditional function myFunctionWithParameters(firstName, lastName) { return `My first name is ${firstName}, and my last name is ${lastName}.` } // arrow myModernFunctionWithParameters = (firstName, lastName) => { return `My first name is ${firstName}, and my last name is ${lastName}.` }- Arrow: Arguments are in the parentheses and the function is inside the curly braces
- String with variables needs to be surrounded by backticks
Functions Inside Methods: Traditional vs Arrow
// traditional [1, 2, 3, 4, 5].filter(function(d) { return d < 3 }) // arrow [1, 2, 3, 4, 5].filter(d => d < 3)- The argument is d but without parentheses and the function is
d < 3without the curly braces - The function inputs each row/value of the array, so d is a row/value of the array. Then, the function does something to that row.
- The argument is d but without parentheses and the function is
Conditionals
==vs===1 == '1' // true 1 === '1' // false==is a logical test to see if two values are the same
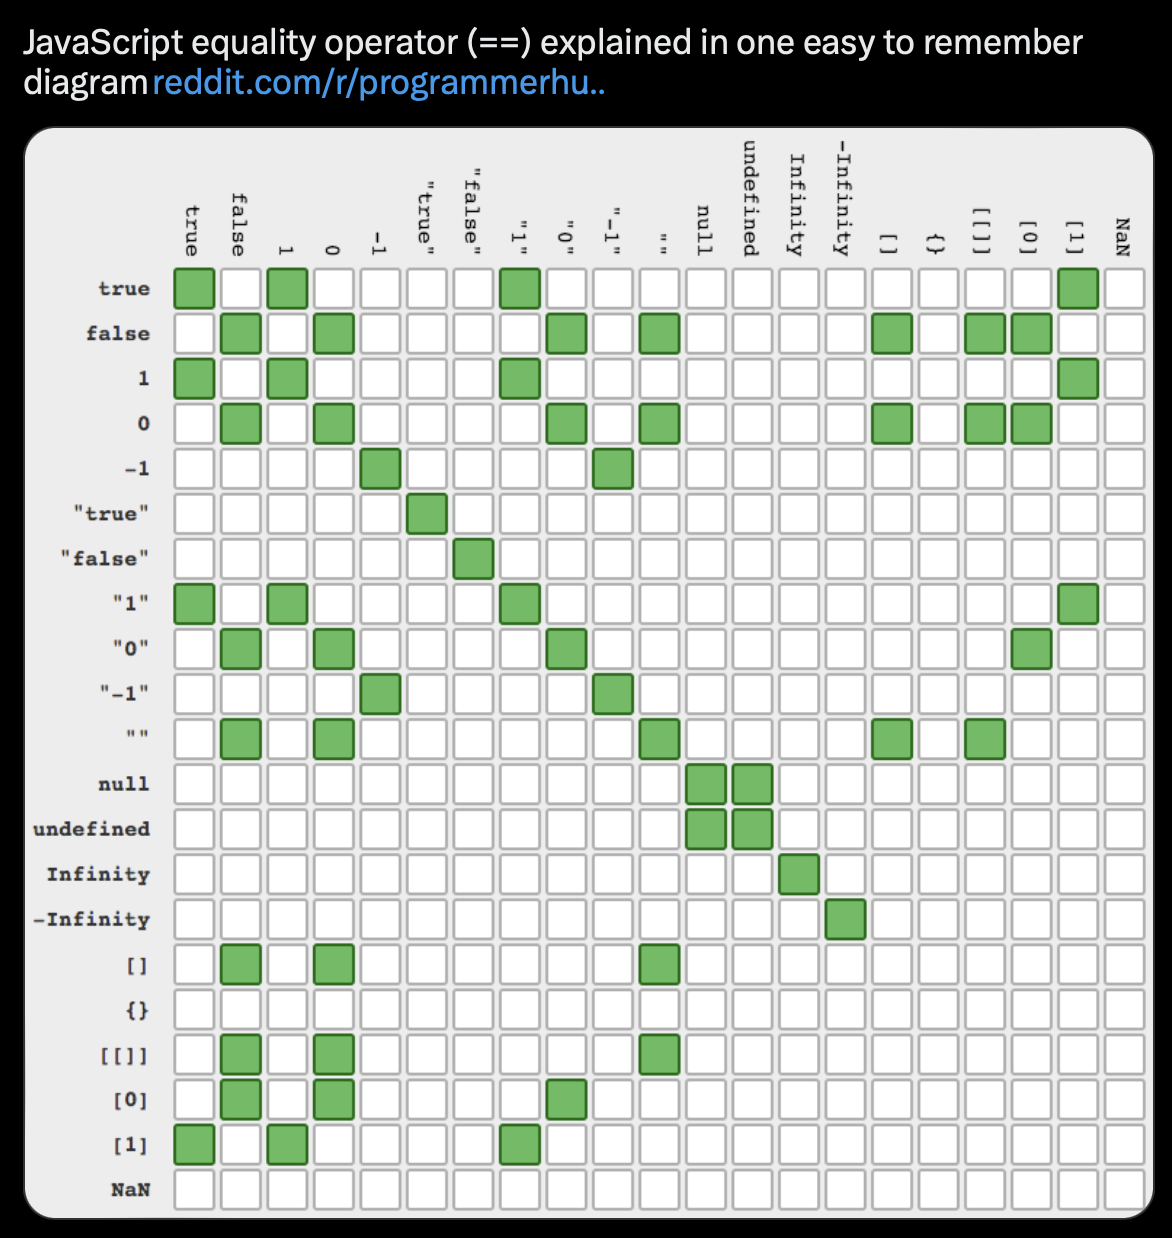
===is a logical test to see if two values are the same and also checks if the value types are the same
If/Then
if(1 > 2) { // If this statement is true return 'Math is broken' // return this } else { // if the first statement was not true return 'Math still works!' // return this } // using ternary operator "?"- Using ternary operator “?”
- Syntax:
condition ? exprIfTrue : exprIfFalse - Example:
d => d.frequency >= minFreq ? "steelblue" : "lightgray"- Says if the frequency property is >= the variable, minFreq, value, then use steelblue otherwise use lightgray
- Syntax:
- Using ternary operator “?”
For-Loop
let largestNumber = 0; // Declare a variable for the largest number for(let i = 0; i < myValues.length - 1; i++) { // Loop through all the values in my array if(myValues[i] > largestNumber) { // Check if the value in the array is larger that the largestNumber largestNumber = myValues[i] // If so, assign the value as the new largest number } } return largestNumber- The first statement sets a variable (
let i = 0) - The second statement provides a condition for when the loop will run (whenever
i < myValues.length - 1) - The third statement says what to do each time the code block is executed (
i++, which means to add 1 to i)
- The first statement sets a variable (
While-Loop
let largestNumber = 0;                        // Create a variable for the largest number
let i = 0;
while(i < myValues.length - 1) {
    if(myValues[i] > largestNumber) {        // Check if the value in the array is larger that the largestNumber
      largestNumber = myValues[i]            // If so, assign the value as the new largest number
    }
    i++;
}
return largestNumber
Cleaning
Misc
- Notes from: Horst article
Filter objects:
myData.filter(d => d.city == 'Denver')Select properties:
myNewArray = salesData.map(d => ({ date: d.date, product: d.product, totalRevenue: d.totalRevenue }))- In some contexts, this,
d => d["mileage (mpg)"], is also used to select columns
- In some contexts, this,
Arrange objects:
salesData.sort((a, b) => a.totalRevenue - b.totalRevenue)- Reorders salesData by totalRevenue (low to high)
Mutate properties:
salesData.map(d => ({...d, discountedPrice: 0.9 * d.unitPrice }))- Adds a new column to salesData with a discountedPrice, which takes 10% off each unitPrice.
Group_By:
d3.rollup(salesData, v => d3.sum(v, d => d.totalRevenue), d => d.region)- Return the sum of totalRevenue for each region in salesData.
rollupmight actually be asummarizeand thegroup_byis handled in the syntax
Rename:
salesData.map(d => ({...d, saleDate: d.date }))- Adds a new column called saleDate by storing a version of the date with new name saleDate and keeping all other columns.
Subset value:
salesData.map(d => d.description)[3]- Access the fourth value from the description property in salesData
Unite:
salesData.map(d => ({...d, fullDescription: `${d.product} ${d.description}`}))- Unite the product and description columns into a single column called fullDescription, using a comma as a separator.
Left Join: *using {{{arquero}}} tables*
salesData.join_left(productDetails, ['product', 'product_id'])- Join information from a productDetails table to salesData. Join on product in salesData and product_id in productDetails.
Stats
Misc
- Notes from: Horst article
- In examples, waterUsage is the array; waterGallons is the property.
- Notes from: Horst article
Mean:
d3.mean(waterUsage.map(d => d.waterGallons))- Returns a Value
Std.Dev:
d3.deviation(waterUsage.map(d => d.waterGallons))Median:
d3.median(waterUsage.map(d => d.waterGallons))Min/Max:
d3.min(waterUsage.map(d => d.waterGallons))Total Observations (i.e.
nrow):waterUsage.lengthBy Group:
propertyId is the discrete, grouping variable
Mean:
waterMeans = d3.rollup(waterUsage, v => d3.mean(v, d => d.waterGallons), d => d.propertyId)// Returns a map object waterMeans { "A001" => 39.53389830508475 "B002" => 53.57627118644068 "C003" => 27.45762711864407 "D004" => 80.1864406779661 } // View in a JS Table // ** Must be in a separate cell ** Inputs.table(waterMeans.map(([propertyId, meanWaterGallons]) => ({propertyId, meanWaterGallons})))Count:
d3.rollup(waterUsage, v => d3.count(v, d => d.waterGallons), d => d.propertyId)
Conditional Counts:
waterUsage.filter(d => d.waterGallons > 90 && d.propertyId == "B002").length- Applies two conditionals and counts the observations
Ranks
waterUsage.map((d, i) => ({...d, rank: d3.rank(waterUsage.map(d => d.waterGallons), d3.descending)[i] + 1}))- 1 is added so that ranks start at 1 instead of 0
Percentiles:
d3.quantile(waterUsage.map(d => d.waterGallons), 0.9)(e.g. 90th)
Observable
- Misc
- Notes from
- Notebook
- A collaborative, online notebook platform that comes with libraries loaded to make it fairly straightforward to dive into ad hoc data analysis or produce complete reports.
- In Observable, if you’re running a JavaScript cell that contains more than just a simple variable assignment (like
myVariable = 'Hello World'), you need to run a code block (i.e. bracket lines of code in curly braces, {}). - You can open your notebook in Safe Mode and edit your work without running it.
- Good for debugging (e.g. infinite while-loops)
- If you change code in one cell, it automatically updates other cells that depend on it. So, no need to rerun cells that depend on the cell with the changed code
- Example: EDA Workflow
- From Account’s Home Page \(\rightarrow\) Click New Notebook (top-right)
- Select a Workspace (Left Panel) \(\rightarrow\) (Optional) Select a Template (Middle) \(\rightarrow\) Click Create Notebook (Bottom Right)
- If no template selected, then a blank notebook with a markdown cell opens
- Add Data
- Click Files (Right Panel, Top)
- Choose File Attachments or Cloud
- File Attachments: Click or drag a file and drop into attachments area
- Create a Table
- To right of file name in the Attachments window there’s an icon. Click it and a table is created
- Create a Scatterplot
- Click the below the current cell to add a cell
- In pop-up window, type scatter in Filter window and click Scatterplot chart
- In Scatterplot code cell,
- Replace toy data name (e.g. cars) in code with the name of the cell that has your data
- Replace names in the x and y attributes with the names of the columns from your dataset
- Framework - Static Site Generator (SSG) for data apps (e.g. dashboards)
This is essentially a {flexdashboard}/Quarto dashboard where everything is in html files which are served to the user.
- Additionally it can be easily deployed to ObservableHQ which has built-in activity monitoring.
- Can also be deployed in other places
- Additionally it can be easily deployed to ObservableHQ which has built-in activity monitoring.
Notes from Static sites for data apps?!
Data Loaders - Generate data from code which then become part of the site.
- This can be a shell (.sh), R, Python, or Rust script, etc. that downloads a data file and gets converted into a parquet file.
- Preprocessing code can also be included.
Advantages of SSG
- Speed - App doesn’t have to be continually rebuilt. Database doesn’t have to be repeated queried (See below)
- Cost - Database is not continuously queried since it’s sent to the user in the form of a parquet file.
- Hosting - HTML files can be hosted from anywhere (even an S3 bucket).
- Security - With Dynamic website serving, code is constantly being ran to build the dashboard and query databases. These process are common attack vectors. With SSG, only files get served.
- Robustness - SSG has fewer moving parts which means fewer things can break
Traditional BI app architecture (Dynamic Websites)

- Webserver (top-mid) in the cloud gets code to build the dashboard from disk (bottom-left) or from a database (top-left)
- Webserver gets the data from a database (top-right)
- Webserver serves dashboard to user’s browser (bottom-center).
- User performs an interaction which gets sent to the webserver and those process begins anew.
SSG approach


- (Left) Webserver (top-mid) in the cloud gets data and code to build dashboard from a database (top-left) and disk (bottom-left) and packages both components (bottom-mid)
- (Right) Webserver gets dashboard from package and serves it to the user’s browser
- (Right) User performs an interaction which gets sent to the webserver. Webserver generates the new dashboard from the package and serves it to the user’s browser.
- (Right) Part of the package that gets sent to user can be a database (e.g. duckdb, sqlite) which can get queried directily in the browser.
Definitions
JSON vs R List
{                              list(
    boolean: true,                boolean = TRUE,
    string: "hello",              string = "hello",
    vector: [1,2,3]                vector = c(1,2,3)
}                              )

// Access                      # Access
json.vector                    list$vector
Dependencies
HTML                                                  R (shiny)
<head>                                                tags$head(
    <!-- JavaScript -->                                  tags$script(src = "path/to/file.js")
    <script src="path/to/file.js"></script>              tags$link(
    <!-- CSS -->                                          rel = "stylesheet",
    <link rel="stylesheet" href="path/to/file.css>        href = "path/to/file.css
</head>                                                  ))
d is each row and
=>is function(d) => d.year === 2020- Says for each row in your data, the year column must equal 2020
Callback Function - A function that is passed to another function as a parameter. In other words, a function “calls back” to previously defined function.
function print(callback) { callback(); }callbackis the callback function and is a parameter of theprintfunctionCallbacks make sure that a function is not going to run before a task is completed but will run right after the task has completed.
Example:
// "Click here" button in a web app <button id="callback-btn">Click here</button> document.queryselector("#callback-btn") .addEventListener("click", function() { console.log("User has clicked on the button!"); });- First, button selected by its id, and then we add an event listener with the
addEventListenermethod. It takes 2 parameters. The first one is its type, click, and the second parameter is a callback function, which logs the message when the button is clicked.
- First, button selected by its id, and then we add an event listener with the
Anonymous Function - Same as a callback but unnamed. It’s a function that is defined within another function.
setTimeout(function() { console.log("This message is shown after 3 seconds"); }, 3000); // if the function were named const message = function() { console.log("This message is shown after 3 seconds"); } // as an arrow function setTimeout(() => { console.log("This message is shown after 3 seconds"); }, 3000);- The function used as a parameter has no name. console.log is the contents of the function.
Notes From Covidcast Dashboard
Notes from
- Covidcast Dashboard: reactable + sparkline tooltip (link)
div= vertical label or container ,span= horizontalFormat: type, styling, value
2 divs would result in a 2 element vertical label while 2 spans would be a 2 element horizontal label
Example: A div container holding 2 spans which creates a “date value” horizontal label
"function (_ref) {
var datum = _ref.datum;
return React.createElement(
  'div',
  null,
  datum.date && React.createElement(
      'span',
      {style: {
          backgroundColor: 'black', color: 'white',
          padding: '3px', margin: '0px 4px 0px 0px', textAlign: 'center'
        }},
      datum.date[0].split('-').slice(1).join('/')
  ),
  React.createElement(
      'span',
      {style: {
        fontWeight: 'bold', fontSize: '1.1em',
        padding: '2px'
      }},
      datum.y ? datum.y.toLocaleString(undefined, {maximumFractionDigits: 0}) : '--'
  )
  );
}"
CSS: margin, padding
Format is top, right, bottom, left (ordered like a clock)
Requires units like “px”
No commas separate the values
{margin: '0px 4px', padding: '0px 0px 0px 4px'}- Maybe for 0s it doesn’t matter
- See bkmk in css/definitions for explanations behind specifications with less than 4 numbers
- e.g. 2 is ‘top/bottom left/right’
String manipulation
datum.endDate[0].split('-').slice(1).join('/')- Treats variable as a string object
- Looks in data arg, finds endDate variable
- Its a list variable so requires the [0] (0 part an index?)
- Date format is ymd, so splits value by “-” separator, removes 1st value (year), joins the rest of the values (month, day) with “/”
- If
slice(2), removes first 2 values (left to right)
- If
Conditional
labelPosition = htmlwidgets::JS("(d, i) => (i === 0 || i === 1 ? 'right' : 'left')")- Says that if index of data value, d, is 0 or 1 then label should be positioned on the right of the point, else place the label on the left of the point