Marketing
Misc
- Notes from
- Most marketing AI addresses segmentation, targeting, and budget allocation.
- Tools to engage customers: Salesforce, Marketo, Braze, Facebook Ads, or Google Ads
- Google and Facebook are perennially at the top of charts for highest return on ad spend
- www.singular.net may be useful resource to check from year to year
- Example: run a Facebook Ad campaign for these at-risk customers
- Manual: Create a SQL query, pull a list from the data warehouse, download it to CSV, and upload it into Facebook Ads or build an integration
- Automate:
- Reverse ETL
- I think this process is described in the “Manual” part (above)
- Platforms: Flywheel
- Reverse ETL
- Google and Facebook are perennially at the top of charts for highest return on ad spend
- Analytics Tools: Google Analytics, Meta Ad Manager, and HubSpot, are designed to analyze campaigns and the performance of acquisition channels.
- Analyze traffic sources: Are your visitors coming primarily from SEO, paid ads, or social media?
- Track campaign ROI: Which ad performs best?
- Optimize targeting: Identify the most relevant audiences to maximize your results.
- Facebook enables smart mobile user acquisition for mobile brands with 2 methods:
- App Event Optimization (AEO)
- Looks for new-to-you people who are similar to customers you already have in your apps at defined stages
- Value Optimization (VO)
- Looks for people who will spend a certain amount of money in your mobile app
- App Event Optimization (AEO)
- Automate LinkedIn Carousels with R and Gemini
- Details a complete workflow, from connecting to the API and summarizing a blog post into structured points, to generating a custom Quarto document ready for manual review and posting.
- “Carousels achieve an average engagement rate of 24.42%, significantly outperforming plain text posts, which average 6.67%” (source)
- Example on her linkedin page
- SEO in the age of AI
- Notes from hrbrmstr’s summary of The Web Isn’t URL-Shaped Anymore
- A brand no longer “wins” by optimizing individual pages or adding more content or clever keyword placement.
- Instead, it “wins” by making key claims (e.g., prices, features, bios, reviews) clear, extractable, and consistently reinforced everywhere they show up.
- i.e. the coherence and corroboration of assertions across the entire web—inside your site, on marketplaces, social media, third-party aggregators, and wherever else machines are watching.
- There are adversarial actors (competitors, spammers, or bad-faith affiliates) seeking to pollute the training data set and thus distort these graphs and vector models. In a “hostile corpus,” you must both publish and defend your assertions, acting whenever your narrative is contradicted or manipulated elsewhere on the web.
- Stop thinking about pages, and start thinking about the “graph.”
- Use clear, reproducible patterns for your essential facts (in HTML, layout, and copywriting), reinforce those claims across trustworthy third-party sites, build APIs and structured endpoints so machines can ingest your data unambiguously, and monitor how you are described everywhere else.
- The future of SEO isn’t document-first, it’s network-first: meaning, trust, and discoverability are decided by how well your claims are learned and connected—not how well a page is optimized or how many URLs appear in search results.
Terms
Action-Based - Clicks, impressions, and GRP data
Adstock - An average decaying function for the carryover effect (see Channel Attribution section)
Advanced Mobile Measurement (AMM) - Facebook’s tracker. Allowed advertisers to access click-through conversion data through their MMP
Affiliate marketing - A type of performance-based marketing in which a business rewards one or more affiliates for each visitor or customer brought by the affiliate’s own marketing efforts.
Carryover Effect - The lag between the time a consumer is touched by an ad and the time a consumer converts because of the ad
Click-in - When a user click on something to reach your website/app
Click-out - The last click a user makes that take them to another website/app
Clearing Price - The final price paid for an impression.
CPC - Cost Per Click - refers to the cost an advertiser pays each time an online user clicks on his or her digital ad
CPM - Cost Per Thousand Impressions is the amount advertisers are willing to pay for every one thousand impressions they receive
\[ CPM = \frac{\text{Campaign Budget} \cdot 1000}{\text{Number of Desired Impressions}} \]
eCPM or effective CPM is the predicted revenue earned by a publisher for every one thousand impressions; metric for ad testing
\[ eCPM = \frac{\mbox{Estimated Earnings} \cdot 1000}{\mbox{Total Impressions}} \]
- Factors that affect eCPM (for all, more is better)
- Monthly website traffic
- Number of ad networks
- Find ad networks offering better deals](https://www.adpushup.com/blog/the-best-ad-networks-for-publishers/) for different geographical locations
- Viewability Score
- Multiple links in this article
- Factors that affect eCPM (for all, more is better)
Floor prices - Are traditionally used by publishers to increase the closing price of their auctions. Think these are implemented by publishers with second-price auctions when they feel reductions are too large.
GRP - Gross Rating Point. A standard measure in advertising, it measures advertising impact.
- One GRP is one percent of all potential adult television viewers (or in radio, listeners) in a market
- Calculatations:
Percent of the Target-Market-Reached multiplied by the Exposure Frequency.
\[ \begin{align} &GRP (\%) = \frac{100 \cdot \mbox{Impressions} \;(\#)}{\mbox{Defined Population}\; (\#)} \\ &GRP (\%) = 100 \cdot \mbox{Reach}\; (\%) \cdot \mbox{Average Frequency}\; (\#) \end{align} \]
Examples:
- if you get advertise to 30% of the target market and give them 4 exposures, you would have 120 GRP.
- If an average of 12% of the people view each episode of a television program, and an ad is placed on 5 episodes, then the campaign has 12 × 5 = 60 GRPs.
- If 50% view three episodes, that’s 150 GRPs
Header Bidding - Just the name for technical auctioning process behind bidding on ad space on a website.
- Used to be done by waterfall archetecture where ads would pass from one publisher’s website to another until it reached one with a price floor that was below the advertiser’s bidding price
Ideal customer profile (ICP) - Customers who bring in the most long-term value for a company
Identifier for Advertisers (IDFA) - a random device identifier assigned by Apple to a user’s device. Advertisers use them to precisely target and track users within apps on iOS devices
Impression - An instance of each time your ad is shown on a search result page or other site on the Google Network. (i.e. number of people your ad reaches)
- Each time your ad appears on Google or the Google Network, it’s counted as one impression.
- In some cases, only a section of your ad may be shown. For example, in Google Maps, we may show only your business name and location or only your business name and the first line of your ad text.
- You’ll sometimes see the abbreviation “Impr” in your account showing the number of impressions for your ad.
Inventory - the amount of ad space (or the number of advertisements) that a publisher has available to sell. While the term originated from print, it has grown to encompass ad space on the web and on apps and mobile ads
Price Floor - The minimum price a publisher will accept for its inventory — ignoring all bids below that price.
Reduction - Money saved in a second-price auction; difference between the bid price and the clearing price
RPM - similar to eCPM; it’s the amount earned by publishers per thousand pageviews
Touchpoint - any time a potential customer or customer comes in contact with your brand–before, during, or after they purchase something from you. Interactions with marketing campaigns and the home page provide rich information about who they are and what they like
- Examples:
- Before Purchase: Social media, Ratings and reviews, Testimonials, Word of mouth, Community involvement, Advertising, Marketing/PR, visits your website
- During Purchase: Store or office, Website, Catalog, Promotions, Staff or sales team, Phone system, Point of sale
- Post Purchase: Billing, Transactional emails, Marketing emails, Service and support teams, Online help center, Follow ups, Thank you cards
- Examples:
UTM - Urchin Traffic Monitor - used to identify marketing channels or results from ad campaigns
- Name comes from Urchin Tracker, a web analytics software that served as the base for Google Analytics.
- e.g. http://yourwebsite.com/your-post-title/?utm_source=google
- utm code = string after “?”
- separate each UTM parameter with the ‘&’ sign.
- This person clicked a google ad to get to your site
- utm code = string after “?”
- Google URL builder tool
- See article for me details, best practices, etc.
- Parameter types
- utm_source - traffic source (e.g. google, facebook, twitter, etc.)
- utm_medium - type of traffic source (e.g. CPC, email, social, referral, display, etc.)
- utm_campaign - campaign name, track the performance of a specific campaign
- utm___content - In case you have multiple links pointing to the same URL (such as an email with two CTA buttons), this code will help you track which link was clicked (e.g
utm_content=navlink) - utm_term - track which keyword term a website visitor came from. This parameter is specifically used for paid search ads. (e.g.
utm_term=growth+hacking+tactics)
Use Cases
- Chatbots for lead development, customer support, and cross-selling or upselling
- Inbound call analysis and routing, and customer comment and email analysis, classification, and response
- Marketing campaign automation (including emails, landing page generation, and customer segmentation)
- Channel Attribution
- Marketing mix modeling (MMM)
- Multi-touch Attribution Modeling (MTA)
- Unified Approach Online product merchandising
- Pricing Product or service recommendations and highly personalized offers
- Programmatic digital ad buying ( digital ads are served up almost instantaneously to users)
- Sales lead scoring
- Social-media planning, buying, and execution
- Social-media sentiment analysis
- Television ad placement (partial)
- Web analytics narrative generation
- Website operation and optimization (including testing)
- Sales propensity models in customer relationship management (CRM) systems
- Automated Tasks
- Send a welcome email to each new customer
- Chatbots on social media platforms
- Start with a stand-alone non-customer-facing task-automation app, such as one that guides human service agents who engage with customers.
- Less-capable bots can irritate customers. It may be better to have such bots assist human agents or advisers rather than interact with customers.
- Start with a stand-alone non-customer-facing task-automation app, such as one that guides human service agents who engage with customers.
- Once companies acquire basic AI skills and an abundance of customer and market data, they can start moving from task automation to machine learning
- Apps
- Stand-alone applications continue to have their place where integration is difficult or impossible, though there are limits to their benefits.
- Example
- Using IBM Watson’s natural language processing and Tone Analyzer capabilities (which detect emotions in text), the application delivers several personalized Behr paint-color recommendations that are based on the mood consumers desire for their space. Customers use the app to short-list two or three colors for the room they intend to paint.
- Integrated ML/DL
- Netflix - recommendations are on a separate standalone app where the customer needs to request recommendations
- ML that coaches a customer service rep through a call
Metrics
Traffic Source Performance: Analyzing the channels (SEO, social media, ads) that bring in the most qualified traffic.
Bounce Rates, and Average Basket Sizes
Click-Through Rate (CTR): The percentage of clicks relative to the impressions of an ad campaign.
Conversion Rate: The percentage of visitors who complete a target action (e.g., sign-up, purchase).
Customer Acquistion Cost (CAC)
\[ \mbox{CAC} = \frac{\mbox{Sales and Marketing Expenses}}{\mbox{Number of New Customers Acquired}} \]Common Expenses
Employee Salaries (i.e. Sales and Marketing Team)
Ad Spend and Marketing Campaigns (e.g. Social Media Ad Placements, Commercials, Billboard Advertising)
Creative Costs and Production Costs (e.g. Affiliate Marketing, Editing Software)
Technical Tools (e.g. CRM Software)
Content Creation and Digital Marketing (e.g. SEO, SEM)
In-Person Events (e.g. Hosted Events, Trade Shows, Travel Expenses)
Third-Party Professional Services (e.g. Strategy Consulting Fees)
Return on Ad Spend (ROAS)
\[ \mbox{ROAS} = \frac{\mbox{Sales Revenue}}{\mbox{Advertising Budget Spend}} \]
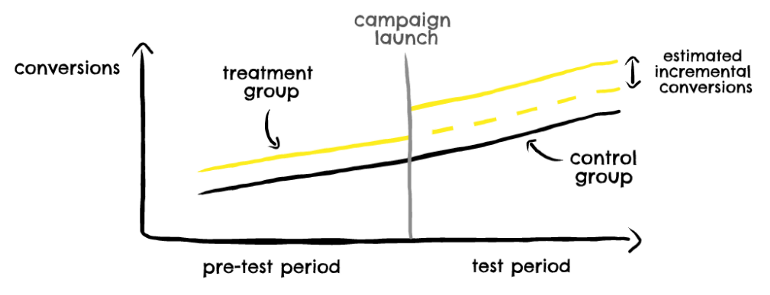
Conversion Lift Tests
Also see
- Data Science >> Algorithms, Marketing
- Data Science >> Business Plots
RCTs on a customer sample that tries to understand the impact of an ad campaign by randomly showing it to one group of users, with-holding it from another, and looking for a difference in behaviour between the two groups over some predetermined period of time.
- Example:
- A typical ecommerce brand might want to understand whether their Facebook ads are driving sales that wouldn’t have happened anyway, and so they’d want to track purchases as a KPI in their lift test.
- Example:
Gold standard of incrementality measurement
- Incrementality Tests also help with re-engagement strategies to highlight the optimal day, post-install, to re-engage users and to ensure the highest incremental lift from your marketing efforts
Alternatives
- A/B tests
- No way to measure incrementality
- The difference seems to be semantics IMO.
- With A/B, the control group gets a “different treatment” and with conversion lift tests, the control group gets no treatment
- Brand Lift Tests
- Seek to measure a campaign’s impact on brand metrics, not conversions
- Geo-experiments (see below))
- Capable of measuring incrementality. Viable alternative to lift tests
- A/B tests
How do you not serve ads to an audience (i.e the control group), yet still “own” the ad real-estate?
- Methodologies:
- Intent-to-treat (ITT) – This method calculates the experiment results based on the initial treatment assignment and not on the treatment that was eventually received (meaning you mark each user for test/control in advance and do not rely on attribution data. You have the “intent” to treat them with ads / prevent them from seeing ads, but there’s no guarantee it will happen).
- Ghost ads/bids – This is another example of a randomly split audience, but this time it is done just before the ad is served. The ad is then withheld from the control group, simulating the process of showing the ad to the user, known as ad serving, without paying for placebo ads. This is a tactic mostly used by advertising networks carrying out their own incrementality tests.
- Public service announcements (PSAs) – These are in place to show ads to both the test and control group however, the control group is shown a general PSA while the test group is shown the variant. The behaviors of users in both groups are then compared to calculate incremental lift.
- Methodologies:
Cost per Incremental Conversion (CPiP)
- Metric used to determine whether the treatment’s effect (e.g incremental conversion) is enough to warrant implementing the treatment in production
- Higher is worse
- Example:
- eCommerce brand spent $100k on their campaign.
- They measured
- 7,500 sales from their campaign’s treatment group (both during and for some fixed time after the campaign)
- 5,000 sales from their campaign’s control group
- 7500 - 5000 = incremental sales
- CPiP = $100,000 / (7500 - 5000) = $40
- If the CPiP < Customer Lifetime Value (CTV) (See Algorithms, Marketing >> Customer Lifetime Value) and this margin is acceptable at which to acquire customers, then the treatment (e.g. ad campaign) can move to production
- Metric used to determine whether the treatment’s effect (e.g incremental conversion) is enough to warrant implementing the treatment in production
Incremental Return on Advertising Spend (iROAS)
\[ \mbox{iROAS} = \frac{\mbox{Treatment Group Revenue} - \mbox{Control Group Revenue}}{\mbox{Treatment Spend}} \]
- Less than 100% you can redistribute budgets to better-performing campaigns and channels
- Equal to or higher than 100% you know you are not cannibalizing organic traffic and that your ads are effective
Geo-Experiments
- Packages
- {GeoLift} - Facebook package for end-to-end geo-experimental methodology based on Synthetic Control Methods used to measure the true incremental effect (Lift) of ad campaign.
- A quasi-experimental methodology where non-overlapping geographic regions (geos) are randomly assigned to a control or treatment group
- Example: ads are served only in the geos of the treatment group while users in geos of the control group won’t be exposed to the advert
- All the major ad networks/tracking platforms allow for targeting ads to the relevant level of location (neighbourhood, city, state, etc.)
- Conversions are measured at a geo-level.
- Steps
- Decide geo-level based on market geography
- country \(\rightarrow\) states
- state \(\rightarrow\) zip codes, Designated Market Area (DMA)
- Don’t select geos that are too small as people may travel across geo-boundaries and the volumes of conversions may be too low
- Perform a preliminary analysis of the geos
- Determine factors that differ between geos that may influence the experiment
- Find geos most similar to each other so the experiment isn’t biased even after randomization
- Assignment
- Randomly assign treatment and contol to geos
- Analysis
- Use difference in differences or synthetic controls to measure incremental conversions
- Example DiD
- Decide geo-level based on market geography
Longitudinal Experiments
- Notes from A Data Scientist’s Guide to Longitudinal Experiments for Personalization Programs
- Longitudinal experiments offer distinct advantages in complex personalization scenarios. They enable a deeper understanding of the cumulative impact of personalized marketing strategies and help determine when to scale these efforts.
- Example: Bike Customization Business
- Contrary to one-time grocery trips, typical shopper journeys at “AvidBikers” consists of a series of online shopping trips to get all parts needed to DIY bikes and upgrade biking equipments.
- So the company launched a personalization program to send weekly best offerings and promotions to their loyal cyclist customer base
- The marketing data science team would like to understand both the individual campaign effectiveness and the overall program-level incrementality from combined personalized marketing strategies.
- Program-level measurement results indicate the overall success of AvidBikers personalization program.
- Campaign-level measurement tells us which specific personalization tactic (personalized offering or promo) is the winning strategy for which subset of the customer base.
- Two-Pronged approach
- Study program-wide effects which refer to the impacts from running the personalization program, which sometimes consists of up to thousands of individual campaigns.
- Study campaign-level impacts which refer to that of sending personalized weekly best offerings vs. promotions to most relevant customers.
- Test and control groups are created on both global level and campaign level.
- Global (Program-wide)
- The test group is the customer base who receives personalized offerings and promos when eligible
- The control is carved out as “hold-out” group.
- Campaign
- Within the global test group, we further carve out campaign-level test and control groups to measure impacts of different personalization strategies.
- Perform a statistical test to validate groups are balanced
- Global (Program-wide)
- Issues
- Dropout
- Customer attrition likely has an uneven impact on test and control groups, creating uncontrolled differences that could not be attributed to the personalization treatment / interventions.
- To address such bias, new customers are assigned into program-level and campaign level test and control groups, followed by a statistical test to validate groups are balanced.
- I think this is probably fine. Mixed effects models handle group imbalance okay, but there will be a loss of power. (See Mixed Effects, General >> Model Equation)
- Perform a “longitudinal quality check” to ensure audience assignment is consistent week over week (?)
- I’m guessing this a test to monitor group balance on a weekly basis.
- Also see
- Missingness >> Misc >> Missingness in RCT due to dropouts
- Other issues such as cold-start, overlapping strategies, etc. could also arise.
- Dropout
- Contrary to one-time grocery trips, typical shopper journeys at “AvidBikers” consists of a series of online shopping trips to get all parts needed to DIY bikes and upgrade biking equipments.
Tracking
- Notes from Conversions without cookies: How to track conversions from Google Ads and Meta without any cookies
- Article also contains SQL code that prepares conversion data to send to advertisers.
- Traditional cookie tracking process when placing an advertisement on Google Ads, Meta, TikTok, LinkedIn, etc.
- Set up your (client-side) tag management system (i.e. Google Tag Manager)
- Add a bunch of conversion tags to your website (or app)
- Collect consent to use the necessary cookies of the advertisement partners you work with
- Whenever a conversion on your site happens, trigger the tag notifying the advertisement partner of the conversion which sends along some information from those cookies so the advertisement partner can identify which activity on their platform is connected to the conversion.
- Current estimates are about 30% of traffic on your site not being trackable (because of ITP, iOS14+, …).
- In a country like Switzerland, where Apple products are widely used, and considering people who simply won’t consent to cookies even if you kindly ask them, this can climb to 40%.
Web Server Logs
- This method can be used in conjuction to client-side methods like cookies to perhaps gain insight on customers that aren’t trackable through cookie or as an alternative.
- When someone opens your website, their browser requests a file (a .html or the like) from the server (i.e. pageview). And usually the server logs those requests (or at least you can make it to). Some website hosts call those “access logs” or “http logs.”
- Typically contain the IP address, user agent of the browser, a timestamp, and the full URI used in the request.
- {ipapi} - Queries IP addresses using the ipquery.io API
Returns these fields
names(ipapi_obj)
#>  [1] "ip"            "asn"           "org"           "isp"           "country"       "country_code"  "city"          "state"
#>  [9] "zipcode"       "latitude"      "longitude"     "timezone"      "localtime"     "is_mobile"     "is_vpn"        "is_tor"
#> [17] "is_proxy"      "is_datacenter" "risk_score"
- User Agent is a string of text that web browsers send to websites to identify themselves. It contains information about:
- The browser being used (Chrome, Firefox, Safari, etc.)
- The browser version
- The operating system (Windows, macOS, iOS, Android, etc.)
- The device type (desktop, mobile, tablet)
- Pageviews from Server Logs
- Can be used to determine the number of sessions and devices that visit your website
- Sessions can be a bit complicated to construct. Author of the article offered to share his SQL code if contacted.
- I used Claude to generate R, Python, and SQL scripts using the data fields he mentioned that were available in the logs and Google’s session definition of a user session (See Google, Analytics, Reports >> Terms >> Session).
- Scripts are in my local Code >> Business Applications >> Web and App directories.
- I used Claude to generate R, Python, and SQL scripts using the data fields he mentioned that were available in the logs and Google’s session definition of a user session (See Google, Analytics, Reports >> Terms >> Session).
- Issues
- No events (clicks etc.) as those do not trigger a request to the server immediately
- Identifying users (even if they log in) might also be rather difficult (unless you configure a login so that it also triggers a request to your webserver)
- Removing bots from the logs
- Remove ips that send a request to your
robots.txtsince their IP/agent can immediately be identified as a bot - Set up a pipeline to determine if an IP/agent belongs to a known bot
- IPQS is recommended
- Add some anomaly detection
- e.g. A session requesting more than 3 pages within 2 seconds is unlikely relevant to you).
- Remove ips that send a request to your
- Conversions
- Add thank-you-page after a checkout.
- Create the URI of this thank-you-page so that it contains (e.g. as query parameters) the information you need to enrich a conversion (particularly its value) or at least contains a reference to a transaction (like an ID) so you can look up this transaction in your logs.
- All you need is the identifier that the advertisement partner requires to attribute this conversion to
- After having modeled sessions in your warehouse, you can identify the first pageview of a session and it’s URI.
- Exporting conversion data to advertisers
- See article for code
- By sending them this data:
- These platforms can tell you exactly which ads led to sales. Instead of just seeing clicks or engagement, you can track which campaigns actually generate revenue.
- It helps their algorithms to target demographics with your ads that are likely to convert.
- You can use features like Meta’s Advantage+ Shopping Campaigns or Google’s Smart Shopping campaigns. These automated systems adjust your bids and targeting in real-time based on which users are most likely to convert.
- For most advertisement partners, this first URI will contain a “Click ID” in a query parameter. A regular expression can extract this ID and you are ready to send a conversion to your advertisement partner.
- For Google, it’s gclid
- For Meta, it’s fbclid
- Caveat: This method assumes the conversion occurs in the same session as the “Click ID.” A device switch or timeout will break this method, but last-click attribution is better than nothing.
- If you have the client-side tracking data in the same DWH, you can simply look up which Click IDs are already caught (and presumably sent to the advertisement partner) by the client-side tracking and only process those Click IDs and conversions not already covered.
- Google has Data Manager
- Meta has a Conversions API
- ETL Tools like Census, Hightouch, Azure Data Factory, etc. can be used to connect to this API and send them the data.
Channel Attribution
Misc
- Also see UTM parameters in Terms on how to use URLs to track different ad accounts.
- When you start tracking the UTM parameters and tying it to the account creation, you can now measure the conversion rate from ad click to purchase.
- The main KPI is now end-to-end customer acquisition cost, rather than cost per click.
- Model should reflect these characteristics
- The concave shape of diminishing returns
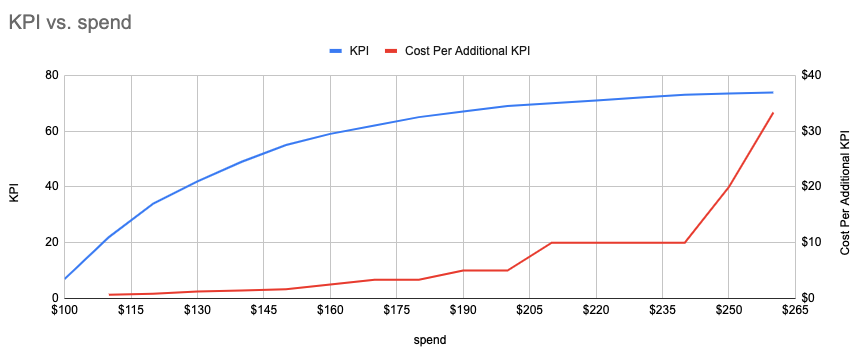
- As the market becomes saturated by your ads, additional ad spend generates less return
sales ~ ln(spend)and you’d have make sure you change the 0s to a really small number or add 1 , e.g y = ln(x+1).- By adding 1, zeroes will be zeros on the log-scale since log 1 = 0
- Carryover Effect
- The lag between the time a consumer is touched by an ad and the time a consumer converts because of the ad.
- Adstock is a decaying function that describes the average carryover effect
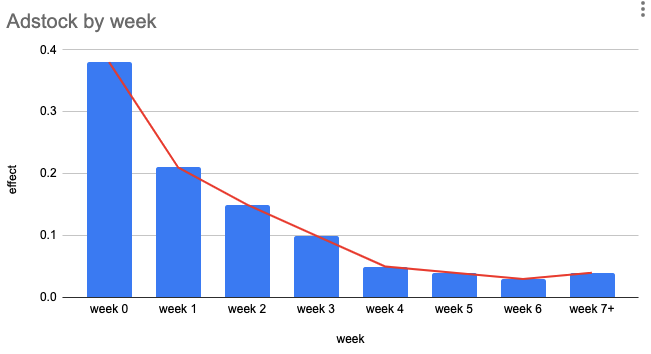
- The advertising effect of this example channel was about 40% in the initial week, then decrease to 20% in the following week, and so on
- Not sure how this “effect” is measured. Maybe it means a 40% increase in conversions during the initial week of the ad buy. Maybe this is measured experimentally. Maybe it’s something like a ratio of conversions after clicks on digital ads/paid search to total clicks on the ad.
- Calculate a “spend_with_adstock” variable
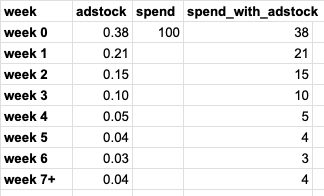
- Decay rate is specific to an ad channel and business type
- Online ads have a more immedicate effect since users are usually ready to buy
- Offline ads have a longer delay since it takes time to respond
- Decay rate is specific to an ad channel and business type
- The advertising effect of this example channel was about 40% in the initial week, then decrease to 20% in the following week, and so on
- The concave shape of diminishing returns
- Typically dealing with sparse data
- There can be a big spike in spending due to a new launch but no consistent spending afterward.
- For certain channels, the budget could be turned off for some time and back on due to market dynamics or business strategy changes.
- In some cases, we can pool together smaller locations that are believed to behave similarly to each other and estimate them using a hierarchical Bayesian model (the same logic can be applied to similar channels)
- Issues
- Self-selection/endogeneity
- Example: Paid Search
- A user already has the brand she wants to purchase in mind and searches the brand name online. Then she clicked the paid search ad and made a purchase. This would incur ad spend, however, the purchase would not be incremental sequence of steps (i.e customer journey) because she would have purchased anyway. So the ad didn’t induce the purchase since the user was already ready to purchase before encountering the ad.
- Upper funnel channels can get less credit than downstream channels
- e.g. A user saw an ad on TV first and wanted to make a purchase online. He then searched for the product on Google and bought it from the paid search ad. The model could attribute more credit to the search if not treated well.
- Solutions
- Informative priors from reliable experimentation on channels with high selection bias to guide the model and prevent the model from being biased towards endogenous channels.
- Instrumental variables to better control for the bias (although instrumental variables may be hard to find or construct)
- Selection Bias Correction approach developed by Google (Paper).
- Google team used DAGs of the search ad environment and derived a statistically principled method for bias correction
- Adjusted for search queries to close backdoor paths.
- After the adjustment, the coefficient for the search channel is much less than that from the naive model and is aligned with the result from the experimentations.
- Example: Paid Search
- Multi-Collinearity
- e.g. Two channels might be launched together to reinforce each other or to support a product launch
- Solutions: variable reduction techniques: PCA, ElasticNet, etc.
- Self-selection/endogeneity
Unified Approach
- Use experimentation results as priors for MMM and use MTA results to validate and calibrate MMM
- Experiment examples: Conversion Lift Tests, Geo-Experiments, A/B Tests, RCTS, etc.
- Use trustworthy priors obtained from experiments or external sources to inform a bayesian model
- A bayesian model with time-varying coefficients can handle violatility of marketing effects (particularly for new companies)
Marketing Mix Modeling (MMM)
Sales (or KPI or etc.) ~ Channel_Spend_1 + Channel_Spend_2+ Trend + Seasonality(s) + Campaigns + Events + Holidays + Weather + Region + … etc.- Other outcome variables
- KPI or google search volume or website visits or account sign-ups
- Alternative Channel
- Other explanatory variables:
- Media cost for each channel
- Product pricing
- Economic indicators
- Synergistic effect between different media (i.e. interaction)
- Competitor activities
- Other outcome variables
- Better for measuring performance of offline traditional Out-of-Home (OOH) media like TV, radio and print which is unlike online advertising where we have access to metrics like clicks, clickthrough rate, impressions, etc.
- Requires relatively large budgets and longer data history to have reliable reads. Sparse data and short data history could make the results biased and unstable
- Typically requires at least 2 years of weekly data (longer is better) and a good volume of media spend.
- For small data situations, reduce the number of features by combining smaller channels and prioritizing bigger channels
- Tends to underestimate upper funnel channels and overestimate lower funnel channels.
- Less likely to get more granular level insights, and will not show the nuances of the user journey
Multi-Touch Attribution Modeling (MTA)
- Also see
- Multi-touch attribution: The fundamental to optimizing customer acquisition (only skimmed, haven’t taken notes yet)
- Unlike MMM, it acknowledges that the customer journey is complex and customers may encounter more than one (or even all) of our marketing channel activities in their journey
- Requires metrics like clicks, clickthrough rates, impressions, etc.
- Therefore, only suited for digital media
- MTA data aims to model the entire user ad journey. However, in reality, the real-world data can be partial and only includes part of the touch points due to tracking difficulty.
- ** MTA is also subjective to user data privacy initiatives, such as Apple no IDFA and Facebook no AMM. In the foreseeable future, Google will also join the force. Without user-level tracking data, MTA models cannot be built. **
- Most MTA methods utilize click data, not impressions, which tends to give more credit to more clicky channels, like search. This can also make the analysis biased.
- Weighting is assigned to these channels based on their touchpoints to determine each channel’s contribution / involvement towards the sale
- Weighting methods:
- Last Click Attribution and First Click Attribution
- assigns 100% weighting to the last/first channel that was clicked on
- Naive default model used on many analytics platforms
- Google switched from this model to “data driven attribution” (see below) in Google Analytics 4 (GA4)
- Time Decay - weighting is distributed based on the recency of each channel prior to conversion. The most weighting will be given to the last channel prior to conversion (PPC). The least weighting is assigned to the first channel.
- Position-Based - the first and last channels each receive 40% of the weighting, with the remainder 20% distributed equally to the middle channels.
- See https://support.google.com/analytics/answer/10596866?hl=en#zippy=%2Cin-this-article for explanations of other rules based models in GA4
- Data-Driven Attribution (DDA) - weighting is assigned objectively by an algorithm based on the probability of conversion, given the touchpoints. Methods like
- Google Search Ads 360 - Markov Chain, game-theory approaches using Shapley values
- GA4
- Analyze the available path data to develop conversion rate models for each of your conversion events
- Use the conversion rate model predictions as input to an algorithm that attributes conversion credit to ad interactions
- Last Click Attribution and First Click Attribution
- Weighting methods:
Mobile Channel Attribution
- Advertising Identifiers - helps mobile marketers attribute ad spend.
- Google’s advertising identifier (GAID)
- Example:
- When a company like Lyft or Kabam runs user acquisition campaigns to gain new mobile customers, a mobile measurement partner like Adjust, Singular, Kochava, or AppsFlyer can help them connect a click on an ad with an eventual app install on a specific device. That helps Lyft know that an ad worked, and that whatever ad network they used for it succeeded.
- if the person who installed that app eventually signs up for an account and takes a ride share, Lyft knows where and how to attribute the results of that marketing effort, and connect it to the ad spend that initiated it. Even better, from Lyft’s perspective, it can use the IDFA to tell mobile ad networks essentially: I like users like this; go find me more.
- Apple’s SKAdNetwork

- Privacy-safe framework for mobile attribution
- Allows advertisers to know which ads resulted in desired actions without revealing which specific devices — or which specific people — took those desired actions.
- You go to an ad network like Vungle or AdColony or Chartboost — or Facebook or Google, for that matter — and kick off an ad campaign. They show your ads to potential new mobile customers, and when one clicks on it and downloads your app from the App Store, Apple itself will handle sending a cryptographically signed notification — a postback — to the ad network. That postback will not include any user or device-specific information, so while it will validate the conversion for marketing purposes, it won’t reveal any personal information of your new app user.
- Can’t be used in Conversion Lift Tests
- Postbacks require a ad campaign ID for the conversion to be attributed to, so it’s not possible to measure the conversion volume from a lift test’s control group (since the control group isn’t exposed to the ad)
Search Engine Marketing (SEM)
Marketing on search engines where you pay to place ads at the top so that the user sees your ads before the organic search results (e.g. Google, Bing, etc.)
- This same methodology can apply to other types of marketing that uses bids, such as Amazon with product placement
Most SEM ads work on an auction system, where you have to place a bid on each of the search terms (can be millions of terms) relevant to your business and if you win a position in the auction(there are usually 2–3 SEM ads per search, or more based on your region and the search engine you are using), then you would pay the cost equal to your bid or lower depending on which auction system the search engine follows.
Auctions
- Types
- First Price Auctions: A model wherein the buyer pays exactly the price they’ve bid on any given advertising impression. (greater transparency)
- Second-Price Auctions: A model wherein the buyer pays $0.01 more than the second highest bid for an ad impression.
- Example: 3 bidders
- Bids
- Bidder A $2.20
- Bidder B $2.80
- Bidder C $2.50 first-price auction: B wins
- Clearing Price will be the same as the bid- $2.80
- Second Price auction: B wins
- Clearing Price = $0.01 + Decond-Highest Bid ($2.50) = $2.51
- Reduction = $2.80 (Winning Bid) - $2.51 (Clearing Price) = $0.29
- Bids
- Types
Bid Shading
- Technique buyers use in first-price auctions in an attempt to avoid overpaying
- Takes a maximum possible bid and tries to forecast the market value for a given impression, in order to determine the actual bid price to submit.
- Outcome: bid price; model features: site, ad size, exchange and competitive dynamics
- If win rates decrease, the algorithm raises the price they pay
- Some publishers (google, bing, etc.) use intelligent price floors to counteract bid shading
Optimize bidding for value vs traffic volume characteristics of key words
- Sparsity Issues (i.e. Zero-Inflation)
- Due to the long tail nature of the search terms (some search terms are more popular than some other obscure ones)
- Due to the conversion ratio itself — not every click from these SEM ads converts to a purchase
- What should the outcome variable be? (binary: conversion/no_conversion or numeric: bid value)
- Other considerations
- How does the effect of a competitor’s bid change based on the type of auctioning method?
- Seasonality?
- Pre-corona vs post-corona?
- Is there an optimal level of investment?
- Sparsity Issues (i.e. Zero-Inflation)
Bid Elasticity
- Also see Economics >> Price Elasticity
- Notes from How to Calculate the Elasticity of Bids in PPC Marketing
- The higher the bid Google or Amazon receives, generally, the higher the supply of slots they will provide (and hence, the higher the chances of getting a click).
- Basic Formula for Bid Elasticity of Supply
\[ \mbox{Price Elasticity of Bids} = \frac{\text{\% Change in Metric}}{\text{\% Change in Bid Prices}} \]- \(\text{Metric}\) can be impressions, clicks, impression share, etc.
- Non-Normalized metrics are misleading
- Factors that can that influence raw metrics
- Fluctuations on how much you bid
- How many times you bid at a certain price.
- Temporal effects
- A €0.30 bid in high vs low demand cycles can get your into less vs more auctions. It is the same bid, but the amount of competition changes.
- External effects
- Google is famous on having factors such as relevance and accuracy as part of their ad ranking logic. If Google decides to change this, your same bid could get into more or less auctions.
- Fluctuations on how much you bid
- Clicks (metric) vs Bid Price
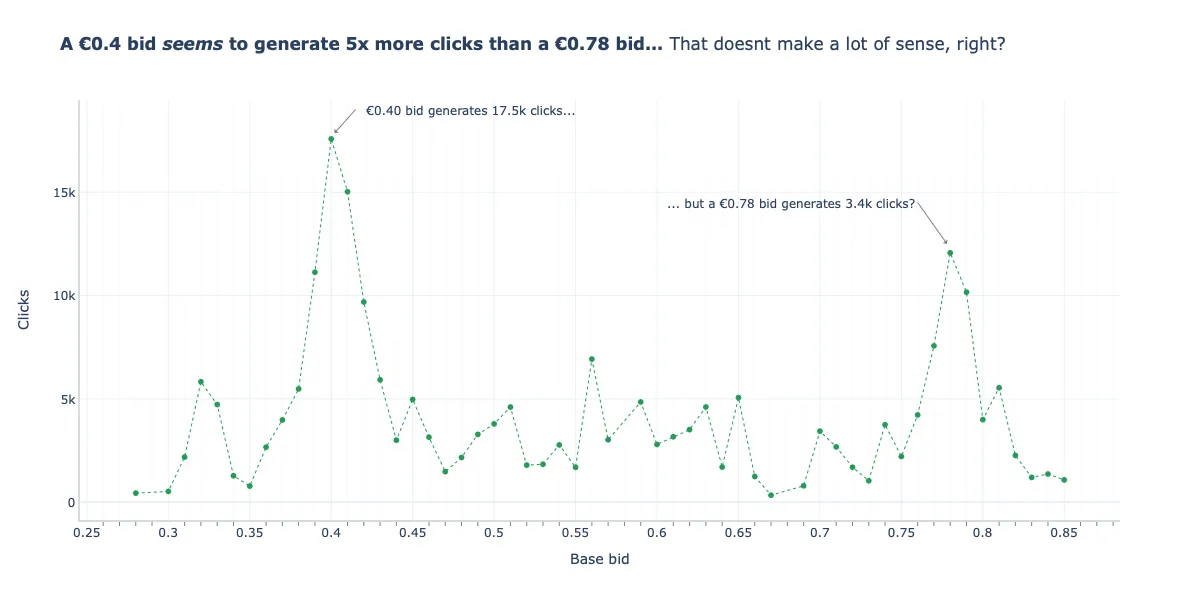
- The bid price at €0.40 resulted in more clicks than the €0.70 bid price
- This apparently shows that an increase in bid price does not lead to an increase in supply (i.e. increase in advertising slots \(\rightarrow\) opportunities for clicks \(\rightarrow\) clicks) which is contrary economic theory, but the raw metric (clicks) is misleading
- Clicks (metric) vs Bid Price vs Days Active
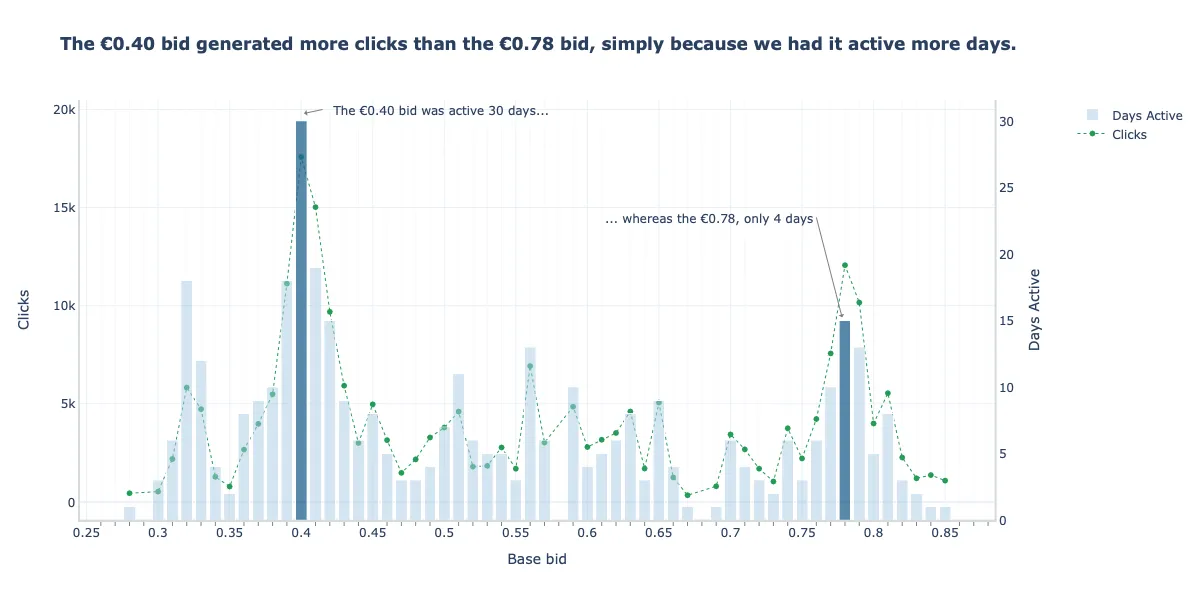
- Since the the bid price of €0.40 was active more days than the €0.70 bid price, it had more click opportunities (first factor affecting raw metrics) which leads to more clicks
- Clicks (metric) vs Bid Price vs Eligible Impressions
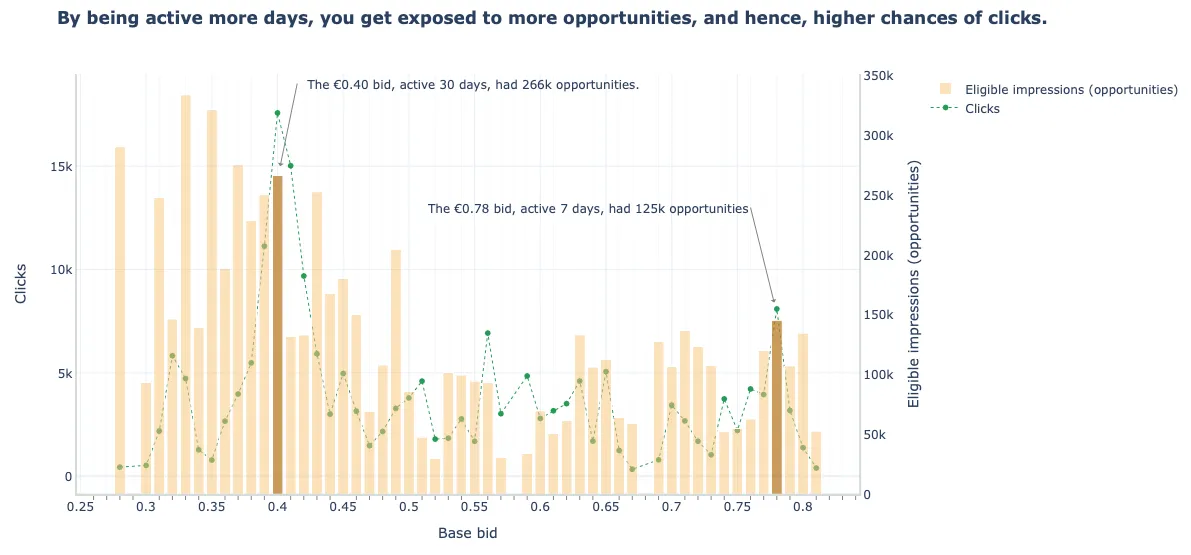
- The €0.40 was in around twice as many auctions (266K eligible impressions) that the €0.70 bid price (125K eligible impressions) which again shows that lower price had more click opportunities which is why it had more clicks
- Factors that can that influence raw metrics
- Normalizing Metrics
- Examples for Clicks
- Impression Share (Impressions / Eligible Opportunities)
- CTR (Clicks / Impressions)
- Clicks / Eligible Opportunities
- Click Coverage (your clicks vs the whole market of clicks)
- Clicks per Eligible Opportunity vs Bid Price
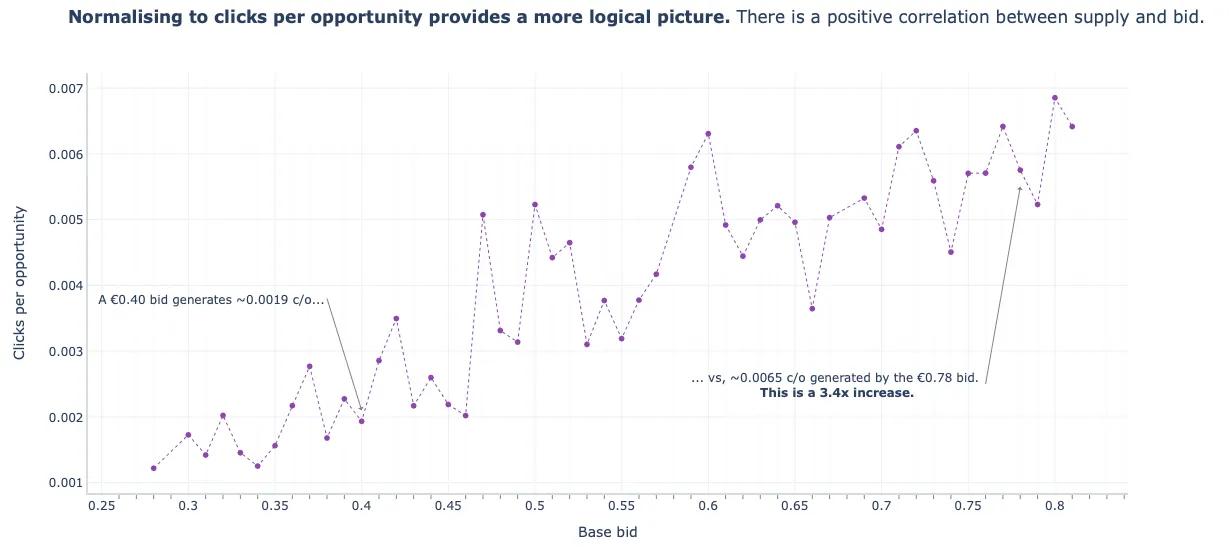
- Now we see the behavior that economic theory teaches us, supply (i.e. increase in advertising slots \(\rightarrow\) opportunities for clicks \(\rightarrow\) clicks) increases as bid price increases.
- Note that there are fluctuations because there are many factors that influence the volume of clicks or elgible opportunities
- Examples for Clicks
- Linear Fit
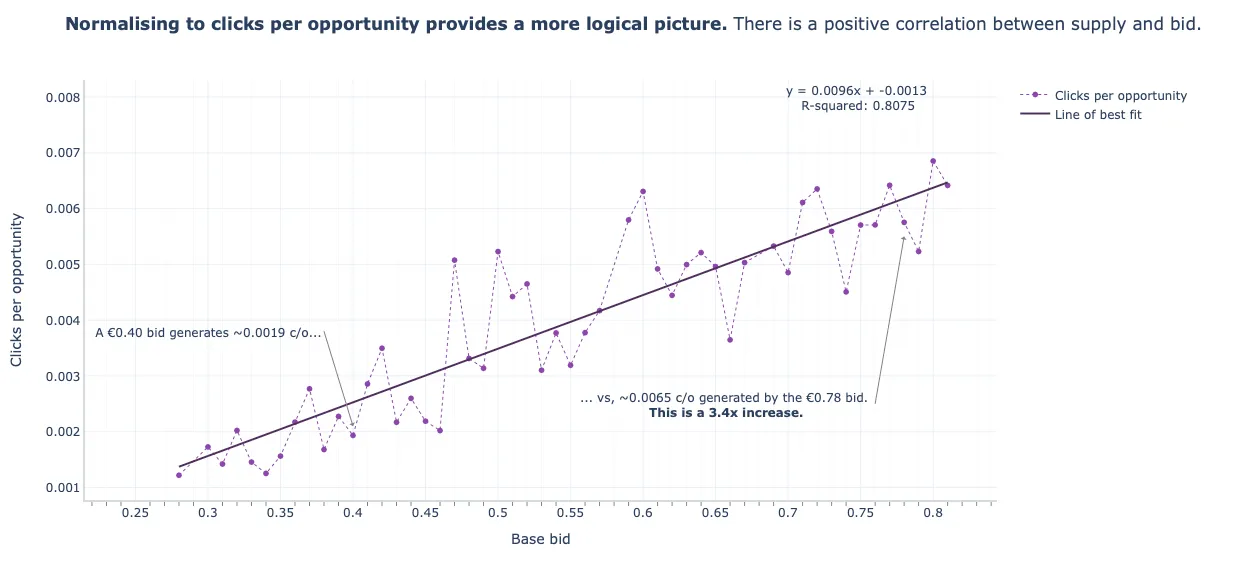
- This is just a simple linear regression line which shows a pretty good fit. The classical model would be to use a log-log regression model, metric ~ bid price with the coefficient as the estimate for elasticity. Other factors can be included as explanatory variables.
Customer Segmentation
Misc
- Also see
- Packages
- {ti} - Time Intelligence and Customer Segmentation for Financial Analysis
- Functions for period-over-period comparisons (year-over-year, month-over-month) and period-to-date calculations (YTD, MTD, QTD)
- Included customer segmentation (ABC analysis, cohorts)
- {ti} - Time Intelligence and Customer Segmentation for Financial Analysis
- Growth Managers help identify the best-performing audience segments for acquisition campaigns.
- Seeks to answer:
- Who are the most valuable customers?
- Where do they come from?
- What do they look like?
- What and how do they like to buy?
- Benefits
- The company can achieve a higher return on ad spend with a smaller marketing budget, yielding a higher profit margin and more room for market expansion.
- Increases marketing efficiency by helping to indicate which campaigns are more likely to succeed with certain groups of customers
Process
- Form marketing hypotheses based on cluster characteristics and test these hypotheses by varying campaigns based on the customer’s cluster membership.
- e.g. Recommend a product they’re likely to purchase, a multi-buy discount, or on-boarding them on a loyalty scheme (e.g. rewards program)
- Once you know who your customers are and what their value is to your business, you can:
- Personalize your products and services to better suit your customers’ needs
- Create Communication Strategies tailored to each segment
- Focus Customer Acquisition to more profitable customers with messages and offers more likely to resonate with them
- Apply Price Optimization to match customer individual price sensitivity
- Increase Customer Retention by offering discounts to customers that haven’t purchased in a long time
- Enhance Customer Engagement by informing them about new products that are more relevant to them
- Improve your chance to Cross-sell and Up-sell other products and services by reaching out for the right segment when they’re more likely to respond
- Test which type of incentive a certain segment is more likely to respond to (e.g. pricing discounts, loyalty programs, product recommendation, etc.)
RFM Analysis

- Recency, Frequency, and Monetary Value Analysis
- The most profitable segments will have low recency, high frequency, and high monetary value.
Data
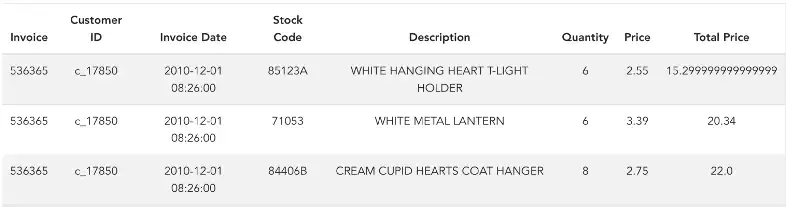
- Just need a transactional database with client’s orders over time (at least 2.5 to 3 yrs of data to capture enough behavior variation).
- time frame could be monthly or yearly or any other time frame required by the business
- Explicitly creates sub-groups based on how much each customer is contributing.
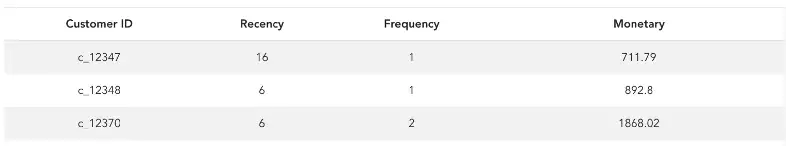
- Recency – How recently did the customer purchase?
- Invoice date can be used to calculate the recency
- Number of days since the last purchase
- Frequency – How often do they purchase?
- Invoice numbers can be used to calculate the frequency
- Number of invoices per month
- Monetary Value – How much do they spend?
- Total price can be used to calculate the monetary value.
- Total monetary value of all purchases in a month
- Recency – How recently did the customer purchase?
Modeling
- Also see
- Algorithms, Marketing >> Customer Lifetime Value >> BG/NBD Gamma-Gamma model
- Video: Bizsci
- lab-49-feature-engineering-customer-segmentation
- lab-58-customer-lifetime-value-rfm-calc
- python customer lifetime value, rfm + xgboost (youtube)
- Group into Quantiles
- Process
- For each RFM variable, rank customers based on values
- For each customer, add up the ranks to get a RFM score
- Bin each customer into a quantile based on their RFM score
- Issues
- Correlation between RFM variables
- e.g. Someone who bought a lot a long time ago could be in the same bin as someone who bought a little recently.
- Should look at the distribution of RFM scores. Grouping into a particular quantiling schema may not be informative
- Correlation between RFM variables
- Process
- Clustering (k-means is popular)
- Cluster Customer IDs based on Recency, Frequency, and Monetary Value variables
- Add additional variables if relevant to helping you choose a market strategy
- If you end up with too many variables for the amount of data you have, then perform PCA before clustering
- Cluster Customer IDs based on Recency, Frequency, and Monetary Value variables
- Interpret clusters and create strategy for each cluster
Example
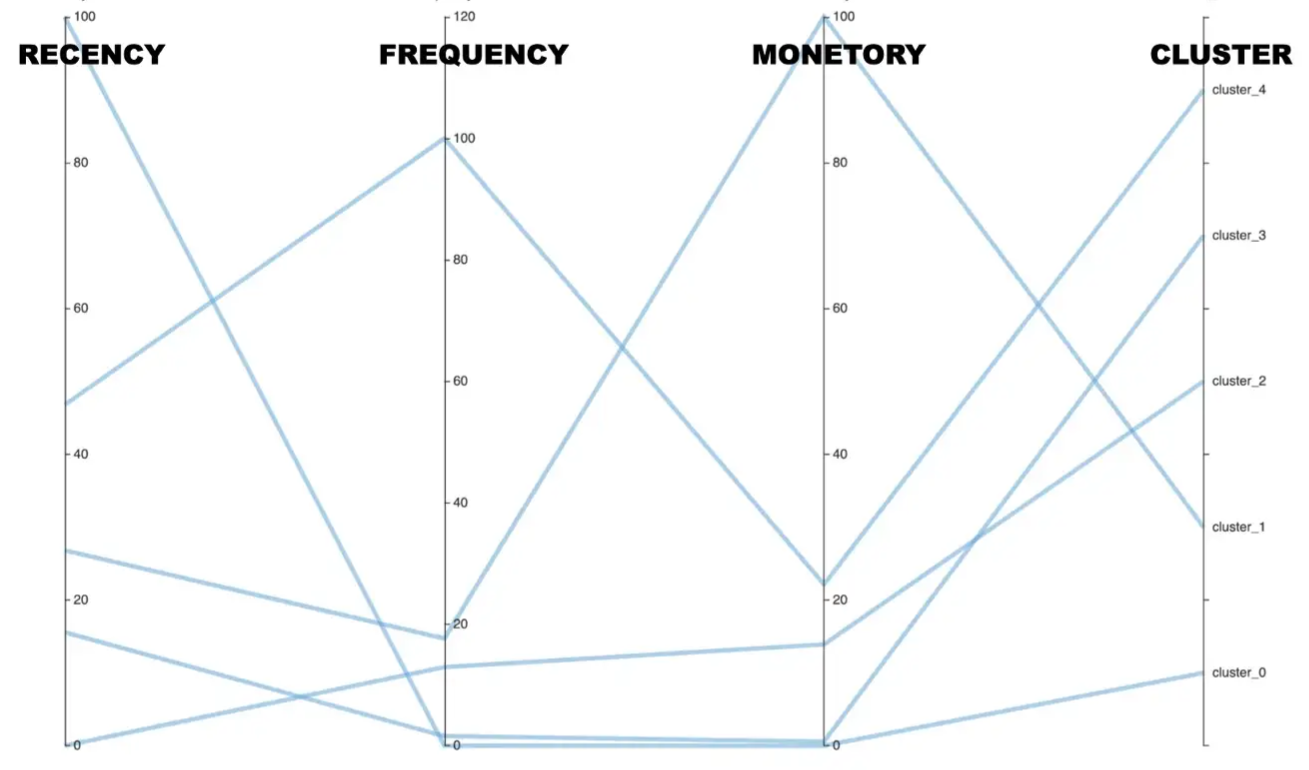
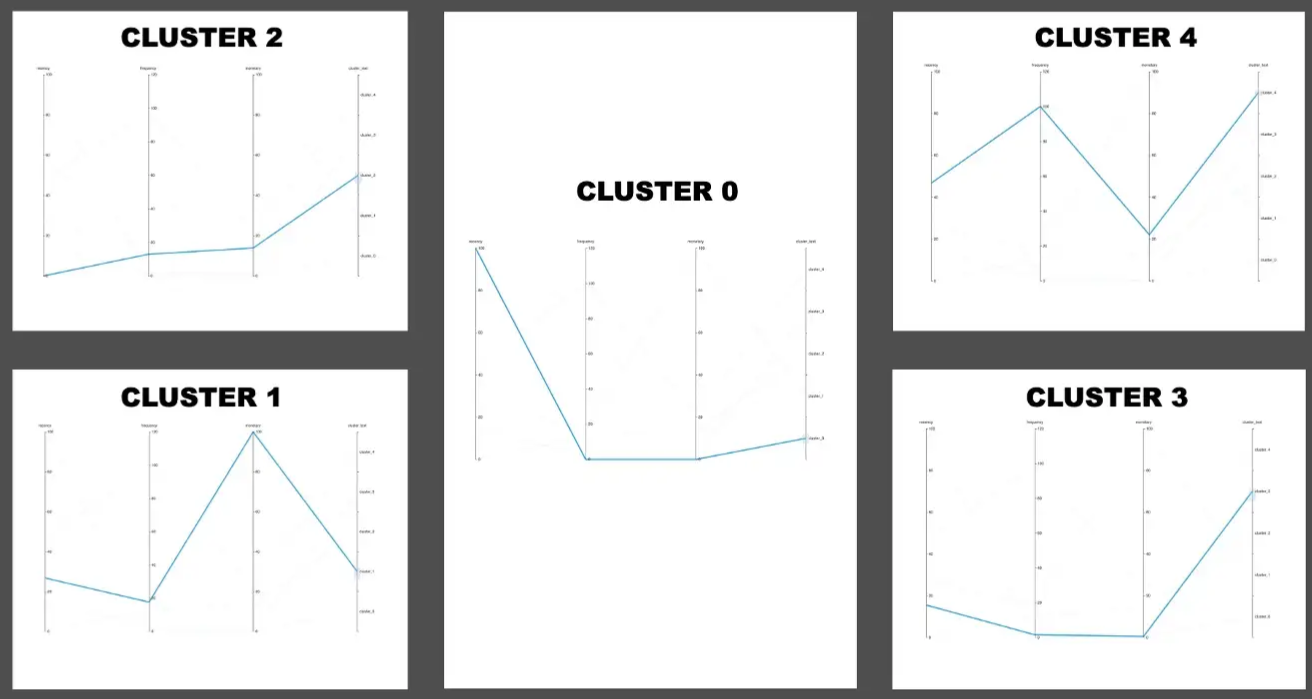
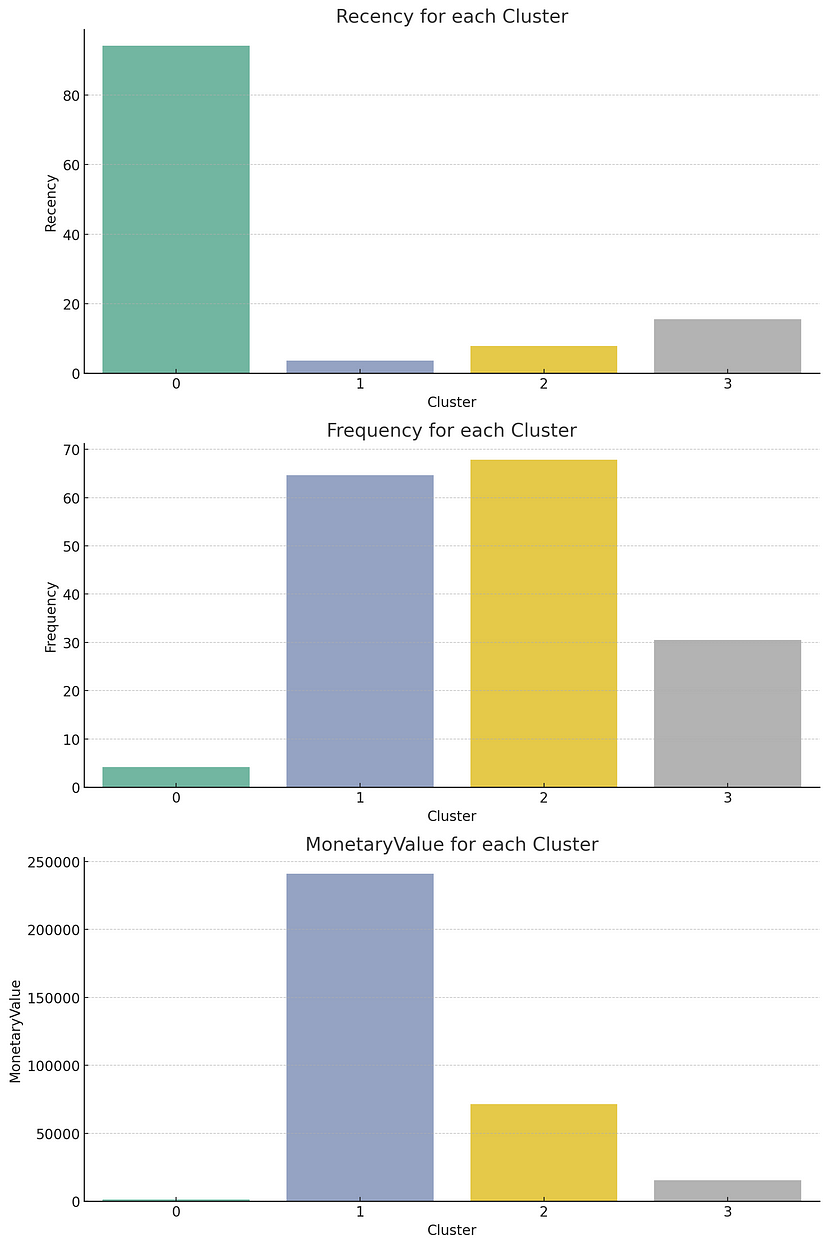
- Charts
- Both charts have the same info, right shows the patterns better but you can’t read the values
- RFM variables were standardized between 0 and 100 before clustering
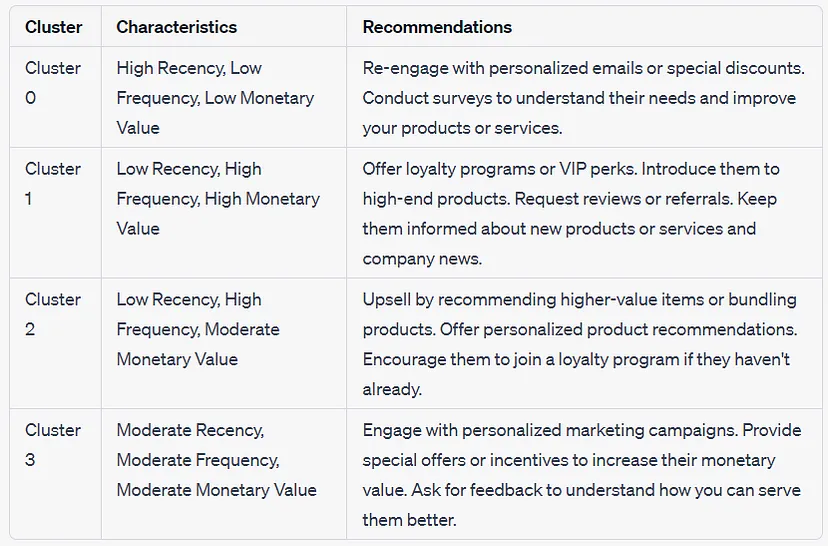
- Cluster 0
- Interpretation — Customers who have not made purchases recently
- Strategy — Make offers to bring them back to purchasing
- Cluster 1
- Interpretation — Customers who have a high monitory value
- Strategy — Create a loyalty program so that they can continue spending more
- Cluster 2
- Interpretation — Customers who have not made purchases recently
- Strategy — Make offers to bring them back to purchasing
- Cluster 3
- Interpretation — Customers who are likely to churn
- Strategy — Retain them with exciting offers
- Cluster 4
- Interpretation — Regular customers
- Strategy — Create a loyalty program to keep them purchasing on a regular basis
- Charts
Example
Example: Categorizing by Rank
- From How to Create an RFM Model in BigQuery (See article for code)
- Advocates
Who They Are: Recent, frequent shoppers with high spending.
Strategy: Ideal for exclusive rewards and further engagement opportunities.
Ranks
recency_rank between 4 and 5
and frequency_rank between 4 and 5
and monetary_rank between 4 and 5
- Loyalists
Who They Are: Customers showing strong recent engagement and significant spending.
Strategy: Deserve recognition and retention efforts, perfect for loyalty programs.
Ranks
recency_rank between 3 and 5
and frequency_rank between 3 and 5
and monetary_rank between 3 and 5
- Promising
Who They Are: Recent customers showing potential but with lower frequency and spend.
Strategy: Need encouragement to boost their shopping frequency and spending.
Ranks
recency_rank between 3 and 5
and frequency_rank between 2 and 5
and monetary_rank between 1 and 5
- Need Attention
Who They Are: Customers who have made a recent purchase but have only done so once.
Strategy: An opportunity to introduce these typically new customers to the brand and products, encouraging deeper engagement.
Ranks
recency_rank between 3 and 5
and frequency_rank = 1
and monetary_rank between 1 and 5
- Losing High Value
Who They Are: Once frequent and high-spending customers now showing decreased recency.
Strategy: Require personalized re-engagement strategies and incentives to rekindle their interest and loyalty.
Ranks
recency_rank between 2 and 3
and frequency_rank between 1 and 5
and monetary_rank between 3 and 5
- Losing Low Value
Who They Are: Customers similar to the high-value segment but with overall lower spending.
Strategy: Also in need of re-engagement efforts, though strategies may differ given their lower value.
Ranks
recency_rank between 2 and 3
and frequency_rank between 1 and 5
and monetary_rank between 1 and 3
- Lost
Who They Are: Customers who have not made a purchase in a long time, making them unlikely to return.
Strategy: Focus efforts on more engaged segments, as re-engaging lost customers may not be resource-efficient.
Rank
recency_rank = 1
Behavioral Segmentation
- Tries to understand how customers interact with your product or website
- Misc
- Data
- Demographics: location, age, gender, and income
- Touchpoints (see Terms): view-through, click-through, the time between each action, etc
- If a user sees an ad on Instagram and quickly swipes over it, that probably indicates they are not very interested in it.
- Often impacted by advertisers’ programmatic push notifications
- Company Website Navigation: visiting behaviors provide enlightening ideas about what a visitor is truly looking for and how they like to shop (See Customer Journey)
- Purchasing: what a user buys, their purchasing frequency and timing, purchasing price and discounts, etc.
- Social media network: Is there an influencer within a customer’s network? (see bkmks >> Network Analysis)
- Example: Telecommunications
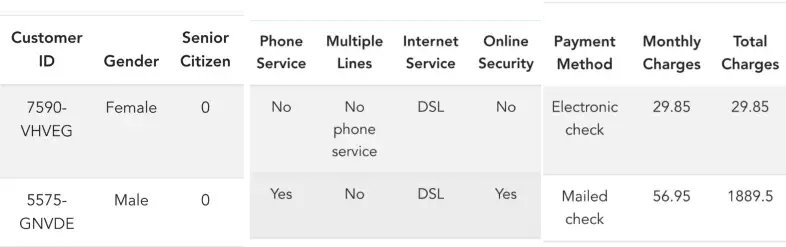
- Cluster the data and interpret the clusters
- Example using the telecommunications data above
- The green cluster (aka segment) is Digitally engaged customers.
- A market strategy could be to create a digital loyalty card and reward them based on the use of digital services. This will in turn also increase revenue for the company.
- The blue cluster is moderately engaged with low tenure.
- A market strategy could be to offer discounts and convert them into long-term contracts.
- The red cluster is basic customers with only phone service.
- A market strategy could be to educate them about the advantages of digital services and then upsell digital products.
- The green cluster (aka segment) is Digitally engaged customers.
- Example using the telecommunications data above
Customer Journey
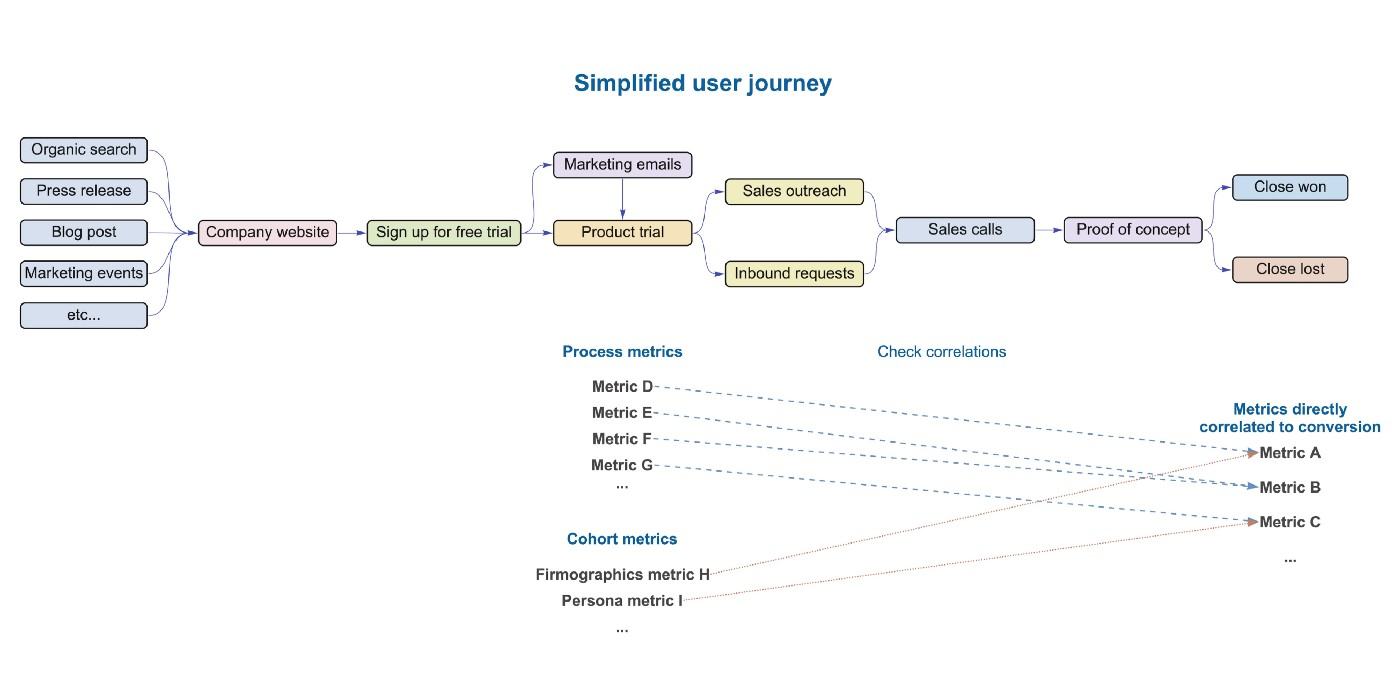
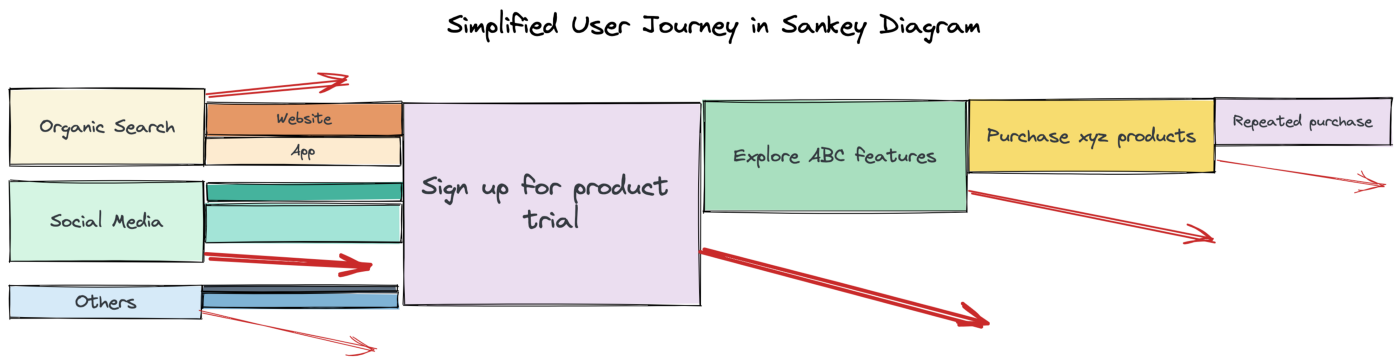
- Top Figure: Typical SaaS User Journey
- Bottom Figure: General User Journey
- Area of the rectangle represents the amount of customers that haven’t dropped off and remain the funnel
- The red arrow represents customers that drop off and don’t convert
- The start of the arrow show the section of the rectangle that represents the amount customer that drop off from on point to the next.
- Misc
- Pre Sale
- When potential customers are in the “consideration” phase and researching a product, AI will target ads at them and can help guide their search
- Determine which customers are most likely to be persuadable and, on the basis of their browsing histories, choose products to show them
- Use extremely detailed data on individuals, including real-time geolocation data, to create highly personalized product or service offers
- When potential customers are in the “consideration” phase and researching a product, AI will target ads at them and can help guide their search
- During Sale
- Upselling and cross-selling and can reduce the likelihood that customers will abandon their digital shopping carts
- After a customer fills a cart, AI bots can provide a motivating testimonial to help close the sale—such as “Great purchase! James from Vermont bought the same mattress.”
- Upselling and cross-selling and can reduce the likelihood that customers will abandon their digital shopping carts
- Post sale
- AI-enabled service agents (chatbots) triage customers’ requests—and are able to deal with fluctuating volumes of service requests better than human agents are
- Can handle simple queries about, say, delivery time or scheduling an appointment and can escalate more-complex issues to a human agent
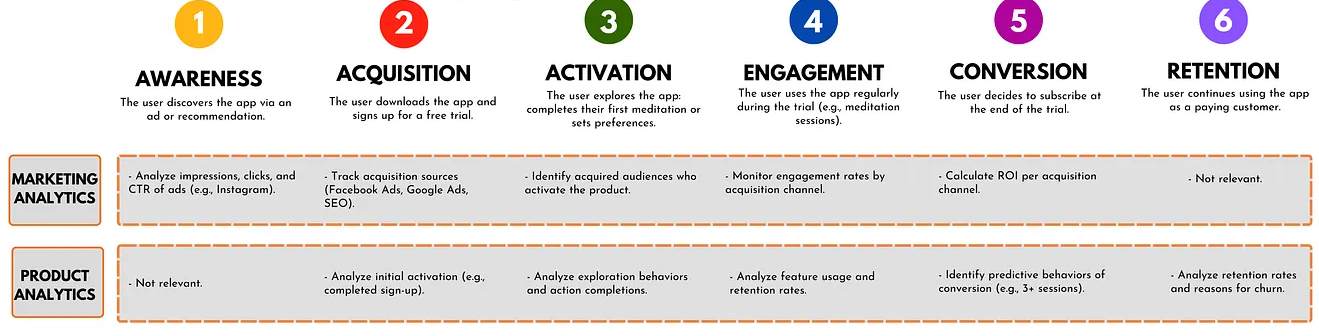
- Product and Marketing Analytics During Customer Journey (source)
Workflow
Find the Ideal Customer Profile (ICP) and Target Them
Notes from article
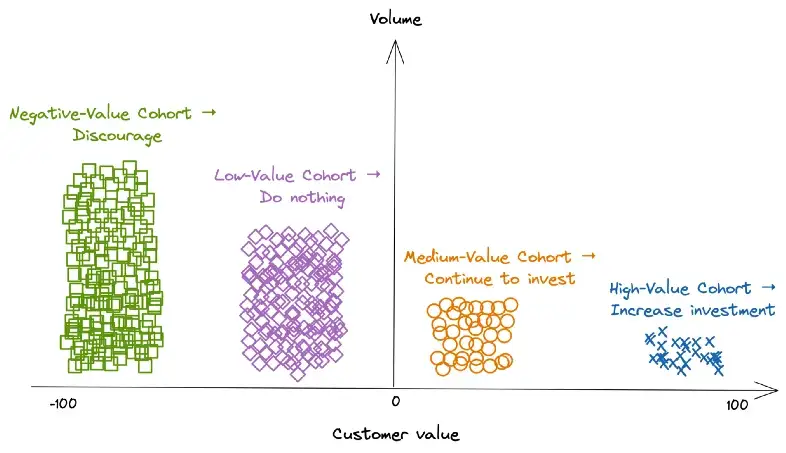
Customer Long Term Value
\[ \mbox{Customer's long-term value} = \mbox{Revenue from the customer's repeated purchase} - \mbox{customer's acquisition cost} \]
Segment in Negative, Low-Value, Medium-Value, and High Value cohorts
- See Customer Segmentation >> RFM Analysis
- Alternatively, based on its sales and marketing attribution systems, the brand can calculate one-year revenue and acquisition costs for each customer (or visitor that doesn’t convert). With that, the brand quickly gets each customer’s value and decides who is worth its marketing budget.
- The split between medium-value segment and high-value segment typically follows the 80/20 rule
The High-Value segment can be further segmented into three smaller cohorts using pca or clustering algorithms.
- See Customer Segmentation >> Behaviorial Segmentation
- The customer data used to cluster can include: interactions with marketing campaigns, browsing history, purchase history, records of using coupons, etc.
- Domain knowledge is usually required to meaningfully label these cohorts and develop marketing plans based on the cluster attributes
- Examples
- Cohort 1 likes to buy the latest model, cohort 2 prefers to buy with discounts, and cohort 3 often makes purchases as gifts
- Cohort 1 reacts positively to campaigns about cool geeky features. On the other hand, cohort 2 engages more with campaigns spotlighting the practical benefits of using a new gadget.
- Cohort 1 trusts YouTubers who talk about the latest and greatest tech products and make purchases after watching unboxing videos. Cohort 2 likes to shop at Costco and buy gadgets at a discount
- Partnering with tech influencers helps the company attract cohort 1 while working with wholesale stores speeds up selling to cohort 2.
Use experimentation on High-Value cohorts to test which acquisition/marketing campaigns have high ROAS.
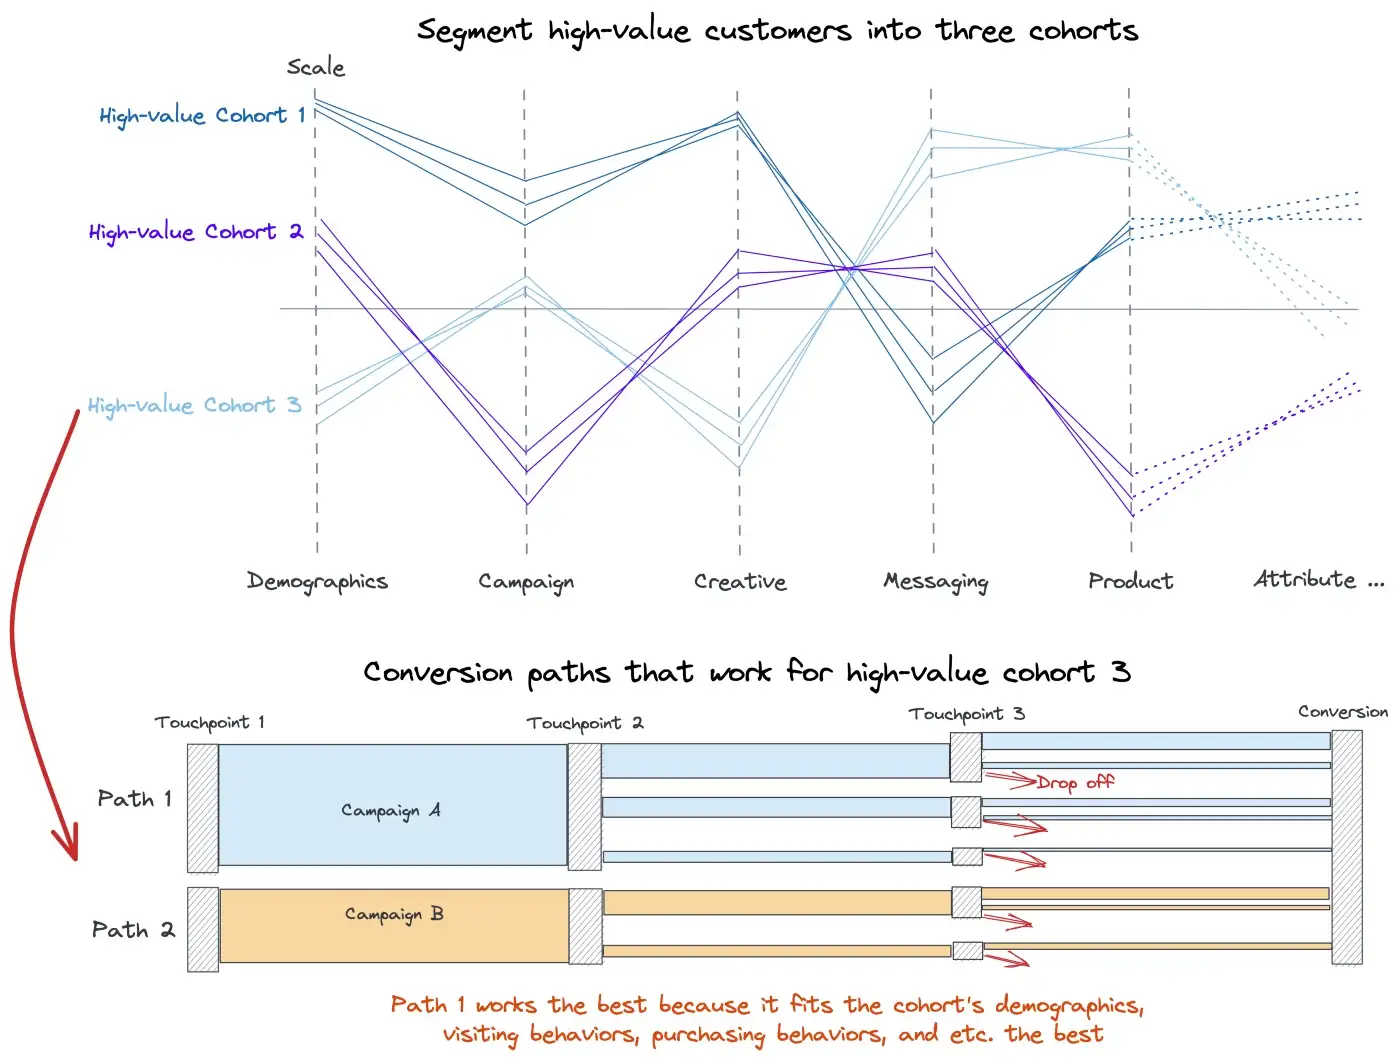
- For cohort 3, campaign A seems to have more success than campaign B
Future campaigns can now target high value cohorts with greater conversion and less expenditure.
Potential Pitfalls
- Make sure the metric fits the business question
- Example: Churn
- Also see Algorithms, Marketing >> Churn
- Don’t model who was most likely to leave, they should have asked who could best be persuaded to stay — in other words, which customers considering jumping ship would be most likely to respond to a promotion.
- i.e. Swing Customers - like politicians looking for swing voters because they are persuadable.
- If you model the wrong objective, you can squander money on swaths of customers who were going to defect anyway and underinvest in customers they should have doubled down on.
- Think this has to be 2 stages
- Filter data before promotions over some window \(\rightarrow\) model traditional churn \(\rightarrow\) filter data after promotion \(\rightarrow\) label which likely churns left and which ones didn’t \(\rightarrow\) model churn with new churn labels using data after promotion because you want probability of churn given promotion
- So you’d have 2 models: 1 to identify churners and 1 to identify swing customers from churners
- Does a lift model help here?
- Think this has to be 2 stages
- Example: Increasing user spend for a video game
- Finding features that increase time spent playing doesn’t efficiently raise revenue or maybe not at all if most of your players play for free.
- e.g. Increasing my time spent playing FOE doesn’t increase FOE’s revenue since I don’t pay for shit on that game.
- Guessing there’s a decent correlation between weekly total_time_spent_playing and overall revenue and they thought they could increase revenue by increasing total time_spent_playing. They should have been looking at correlations between features and spend_per_customer.
- Maybe just filter top spenders and see which features they prefer (i.e. correlated to)
- Finding features that increase time spent playing doesn’t efficiently raise revenue or maybe not at all if most of your players play for free.
- Example: Churn
- Make sure when you increase the accuracy of a model, it doesn’t hurt the bottom line due to a bad tradeoff
- Consider the consumer goods company whose data scientists proudly announced that they’d increased the accuracy of a new sales-volume forecasting system, reducing the error rate from 25% to 17%. Unfortunately, in improving the system’s overall accuracy, they increased its precision with low-margin products while reducing its accuracy with high-margin products. Because the cost of underestimating demand for the high-margin offerings substantially outweighed the value of correctly forecasting demand for the low-margin ones, profits fell when the company implemented the new, “more accurate” system.
- Determine the optimal granularity of predictions
- Consider a marketing team deciding how to allocate its ad dollars on keyword searches on Google and Amazon. The data science team’s current AI can predict the lifetime value of customers acquired through those channels. However, the marketers might get a higher return on ad dollars by using more-granular predictions about customer lifetime value per keyword per channel.
Refine the Business Question
- When defining the problem, managers should get down to what we call the atomic level — the most granular level at which it’s possible to make a decision or undertake an intervention.
- A good business question captures the full impact of the decision on the Profit and Loss (P&L), recognizes any trade-offs, and spells out what a meaningful improvement might look like.
- Gradaute from an extremely vague question to a more finely grained question
- “How do we reduce churn?”
- “How can we best allocate our budget for retention promotions to reduce churn?”
- Has the retention budget been set, or is that something we need to decide?
- What do we mean by “allocate”?
- Are we allocating across different retention campaigns?
- “Given a budget of $x million, which customers should we target with a retention campaign?”
- Define Missed Opportunity metrics
- Identify sources of waste and missed opportunities
- Waste example: targeting a likely-to-churn customer with a promotion that is not persuadable
- Missed opportunity example: not targeting a likely-to-churn customer with a promotion that is persuadable
- Compare the distribution of success versus failure to quantify waste and missed opportunities.
- Measure
- For difficult to quantify situations use aggregate data
- Example of an approach for churn model example using aggregated data
- customers who received promotion: what’s the cost of the promotion incentive relative to the incremental lifetime value
- difference or ratio?
- customers who didn’t receive promotion: what’s the lost profit associated with the nonrenewal of their contracts
- customers who received promotion: what’s the cost of the promotion incentive relative to the incremental lifetime value
- Example of an approach for churn model example using aggregated data
- For difficult to quantify situations use aggregate data
- Identify sources of waste and missed opportunities
- Determine the cause of waste and missed opportunities
- In an ideal world, what knowledge would you have that would fully eliminate waste and missed opportunities? Is your current prediction a good proxy for that?
- In churn example, rather than the basic churn/no churn model, focusing on persuadability would have led to great improvements.
- Does the output of your AI fully align with the business objective?
- Churn example: A persuadable user with low expected profitability should have a lower priority than a persuadable user with high expected profitability.
- Additional factor that further optimizes the solution to the refined business question
- Churn example: A persuadable user with low expected profitability should have a lower priority than a persuadable user with high expected profitability.
- How much are we deviating from the business results we want, given that the AI’s output isn’t completely accurate?
- Quantifying the errors of your model
- Churn example: the cost of sending a retention promotion to a nonpersuadable customer (waste) is lower than the cost of losing a high-value customer who could have been persuaded by the offer (missed opportunity). Therefore, the company will be more profitable if its AI system focuses on not missing persuadable customers, even if that increases the risk of falsely identifying some customers as being receptive to the retention offer.
- In an ideal world, what knowledge would you have that would fully eliminate waste and missed opportunities? Is your current prediction a good proxy for that?