KPIs
Misc
- Also see
- Leaders should focus on 3 to 6 KPIs that will drive growth.
- When a KPI’s growth begins to stagnate, break up the KPI monolith into smaller, more meaningful (and hopefully, easier to optimize) segments
- Optimizing around a single metric will lead to unintended consequences and vulnerabilities
- Systems are complex and ignoring other potentially important factors could result in an overall negative affect
- e.g. If you focus on increasing the volume of a product without also considering the quality, then the result will likely be fewer customers.
- I think this could also pertain to the importance of guardrail metrics.
Terms
- Operationalization - A process of defining the measurement of a phenomenon that is not directly measurable (e.g. happiness), though its existence is indicated by other phenomena. It is the process of defining a fuzzy concept so as to make the theoretical concept clearly distinguishable or measurable, and to understand it in terms of empirical observations.
General
- KPI characteristics
- Monotonic: you always want to drive them higher or lower
- Typically a summary statistic or rate
- Question that you should ask when determining which metrics should be your KPIs
- What do you want to know?
- How much do you need to know?
- Why do you want to know this?
- What is the value or impact between not knowing and knowing?
- Input \(\rightarrow\) Output \(\rightarrow\) Outcome Framework
- Input Metrics
- Provide information about the resources used to create a system or process
- Useful for evaluating the efficiency of a system or process
- What you control: amount of time you spend on a task, the quantity of materials used to produce something, etc.
- Outputs should be highly responsive to your inputs
- Output Metrics
- Provide information about the immediate results of a system or process
- Useful for evaluating the performance of a system or process
- Answers whether the system or process is producing the desired results.
- It should be clear how much your output would change for one additional unit of input.
- Very actionable but not fully under your control
- There is a causal link between your output and your outcome, so difficult to discover
- May require experimentation to determine causality
- Typically tracked daily
- Outcome Metrics
- North Star metrics (See Product Metrics >> Types)
- What you are aiming to move with all your activities.
- Typically requires multiple outputs to move
- Typically tracked monthly or quarterly
- Example: Educational Program
- The number of teachers, their average seniority, the funding of the school (inputs) help drive the grades of the students and their consistency over time higher (output) which ultimately lead to more students graduating high school (outcomes).
- Input Metrics
- Industry Examples
- Financial — Revenue growth, cash flow, burn rate, gross profit
- Customer — Engagement rates, net promoter scores, acquisition costs, conversion rates
- Support & Service — Turnaround time, mean time to resolve, SLA compliance, quality
- Employee — Attrition and retention, satisfaction, engagement
- Governance, Risk, & Compliance — Percent compliance to process, audit compliance, non-security incidents Issues
- Avoid incentivizing the wrong behavior
- As soon as someone’s performance is linked to a metric — it is fair game to expect them to try to move the metric, so it is up to the metric designer to make sure the ‘rules of the game’ are clearly articulated.
- Example: Reducing the number of support tickets opened via email
- Potential Solution: Engineer makes it as hard as possible to contact the email support
- Unintended Consequence: Increasing the number of ‘negative’ social media interactions
- Example: You don’t want to push your salespeople to sell without caring about the retention rate.
- e.g Car salesmen selling a lemon to a customer. Customer unlikely to return to buy another car.
- Solutions
- Pair metric with a guardrail metric (see Product Metrics >> Types)
- Examples
- Quantity (sales) + quality (retention rate)
- Short term metric (inventory level) + long term metric (# of shortages)
- Examples
- Design a compound metric
- By taking into account multiple measurement, it cannot be easily gamed
- Can also include metrics you don’t want move negatively (e.g. cost metrics, guardrail metrics, health metrics)
- For experiments that use this metric, you then create a binary decision rule to decide if your experiment is successful or not.
- Pair metric with a guardrail metric (see Product Metrics >> Types)
- Beware of Deceptive Metrics
- Correlation does not equal causation
- Example: Someone discovers that the number of transactions is correlated w/higher revenue
- Company decides to make number of transactions a metric and starts trying to increase it.
- e.g. Retargeting former customers, offering discounts, etc.
- Revenue doesn’t substantially increase after considerable effort and resources
- Analysis reveals that the revenue is being mostly driven by a few whales buying high-ticket items while the team’s increase in transactions was mostly low-ticket items
- So, the strategy should’ve been to target more whales and not just trying to increase the number of transactions
- Company decides to make number of transactions a metric and starts trying to increase it.
- Checks
- Metric is precise (i.e. measurement isn’t noisy)
- Metric is accurate (i.e. it properly depicts the phenomenon it is supposed to depict).
- Next Steps
- Figure out the best way to calculate these metrics
- Create dashboards to monitor them over time
- Set up alerts when thresholds are crossed
- Anomaly detection
Driver Trees
- Description
- AKA KPI Tree
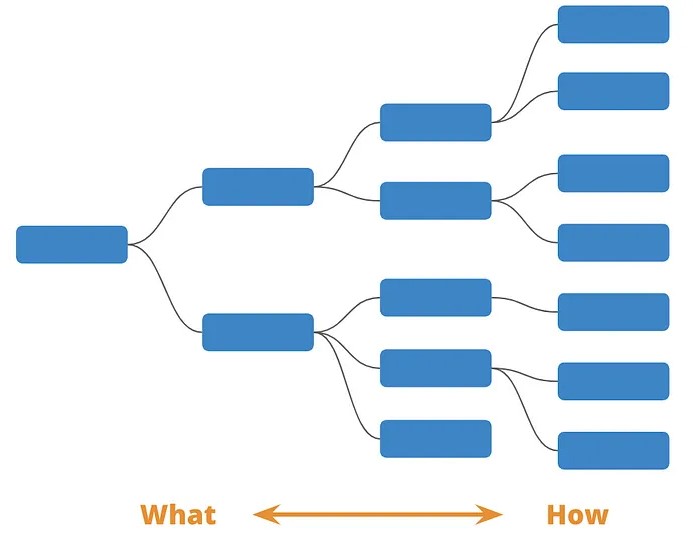
- It’s a map of how different metrics and levers in an organization fit together.
- On the far left, you have an overarching metric you want to drive. This is the ultimate goal you want all the teams to be working towards (e.g. North Star metric).
- As you move to the right, you become more granular in terms of how you want to achieve that goal. Each branch gives you an indicator of the component parts that make up the “what” above them.
- The compounding effect of all the smaller actions rollup to the driver above
- Use Cases
- Helps to breakdown the complex nature of your business and help everyone understand how the overarching pieces fit together.
- What is the business model?
- How do we generate revenue?
- Where do our costs go?
- Fosters alignment across teams, by bridging the gap between customer behaviour, product metrics, and company goals
- The tree is a reference point for conversations between departments and with different stakeholders. A well-built tree means all these discussions will become more outcome oriented.
- Creates understanding about whether you’re making progress toward your goals and tracking the right things. It connects what you’re tracking to your strategy.
- Gives you a clear idea of success and can measure progress in a meaningful way
- Helps to breakdown the complex nature of your business and help everyone understand how the overarching pieces fit together.
- Misc
- Tips
- Overlap is fine. During this process, you’ll find that some metrics and indicators could appear in multiple locations. Although you should aim to minimise overlap, it’s not a major issue. The Driver Tree is a way of abstracting complexity and does not have to be a perfect representation.
- Aim to use metrics as the individual drivers (blocks). This makes each element much more specific and helps you understand what impact you’re actually having. The tree will likely include a combination of business (revenue, cost), departmental (Email Open Rate, Ticket Response Time) and technical (% of API 500 Errors) metrics.
- If you’re stuck, it helps to think of your problem as a math equation. Start with one metric and then think of the inputs used to calculate it. (See Example 2)
- The core of the tree can be developed by a smaller team with a good and broad understanding of how the business works. After the finishing the core, various parts of the core tree should be sent out to the appropriate departments/teams, so that the tree can be extended further.
- Senior Leadership should be involved to facilitate connections
- When there is a natural overlap of different teams, involve them together. This allows a sharing of ideas, perspectives and contexts which the driver tree aims to capture.
- Driver trees can and should be created for projects and not just for the whole organization. In these cases, the trees don’t have to be large or complete. Certain branches can remain incomplete if they aren’t the focus of the project.
- The first draft of your tree will include metrics you know are important and some you assume are important. As part of your Product Development, you will spend time validating (or invalidating them). You don’t have to get it right the first time.
- Make it accessible in your knowledge management tool for anyone in the organization. Have the teams post physical copies of it in their work areas and reference it in their planning and alignment sessions.
- Include it in the onboarding process.
- The driver tree should be updated as the business continues to evolve.
- Make sure to do so any time your strategy changes, your goals or objective change, you make a bigger discovery revelation, or when you find something in your tree is wrong (particularly with metrics that are a hypothesis).
- Create a regular checkpoint to revisit your tree, e.g. once a quarter.
- First Draft
- Get all your ideas onto a physical or virtual whiteboard (e.g. Miro, Mural and Whimsical).
- Put the metrics you have on Post-its and do a whiteboard session to discuss hierarchy and weight.
- Once you’ve started filling out your tree, take time to reflect and minimize overlaps or gaps between branches, where possible.
- Use a dotted line if you have a hypothesis but you need to learn more about the connection to verify if the correlation exists.
- Use a solid line if you are certain that one KPI influences or drives another KPI in a particular way.
- Make sure to share early drafts of your tree and regularly ask for feedback
- Options
- Color Coding Metrics
- Is the metric trusted and available for self service? (e.g. can you look it up on a dashboard whenever you want?)
- Is the metric verified but not available for self service? (e.g. it’s reliable but you need someone else to look it up for you)
- Is the metric not tracked or not available?
- Is the metric unverified or unreliable?
- Lable lines in some way to indicate the strength of the relationship between metrics. (effect size or association?)
- Color Coding Metrics
- Example 1: Conversion Rate (CVR)
Start by adding anything you know (or strongly suspect) that affects conversion rate
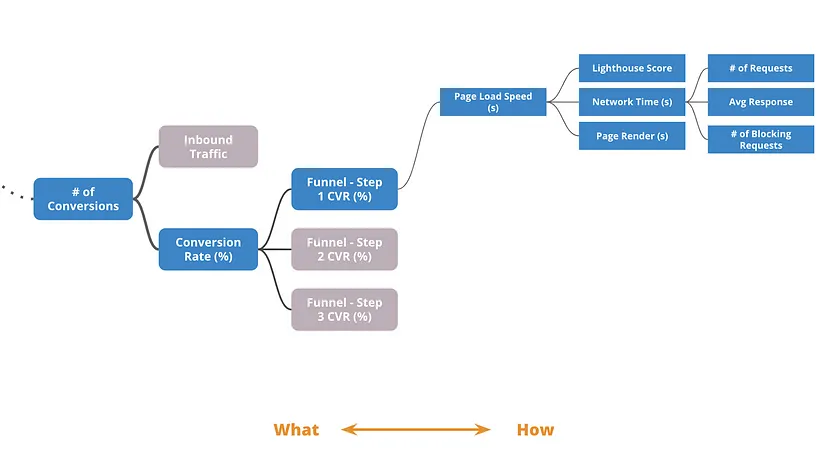
- See Product Development, General >> Misc for details on Lighthouse Score and how webpage load speed affects conversion.
- Then, drill-down as far as you can for each subcomponent.
Continue to expand and drill-down
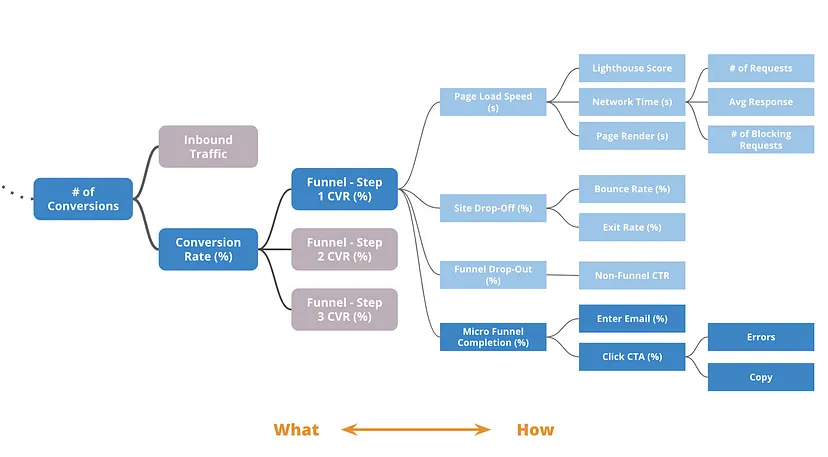
- The other components are Google Analytics metrics
- The “Micro Funnel” is some kind of portal where the user enters an email address.
- Example 2: Monthly Active Users (MAU)
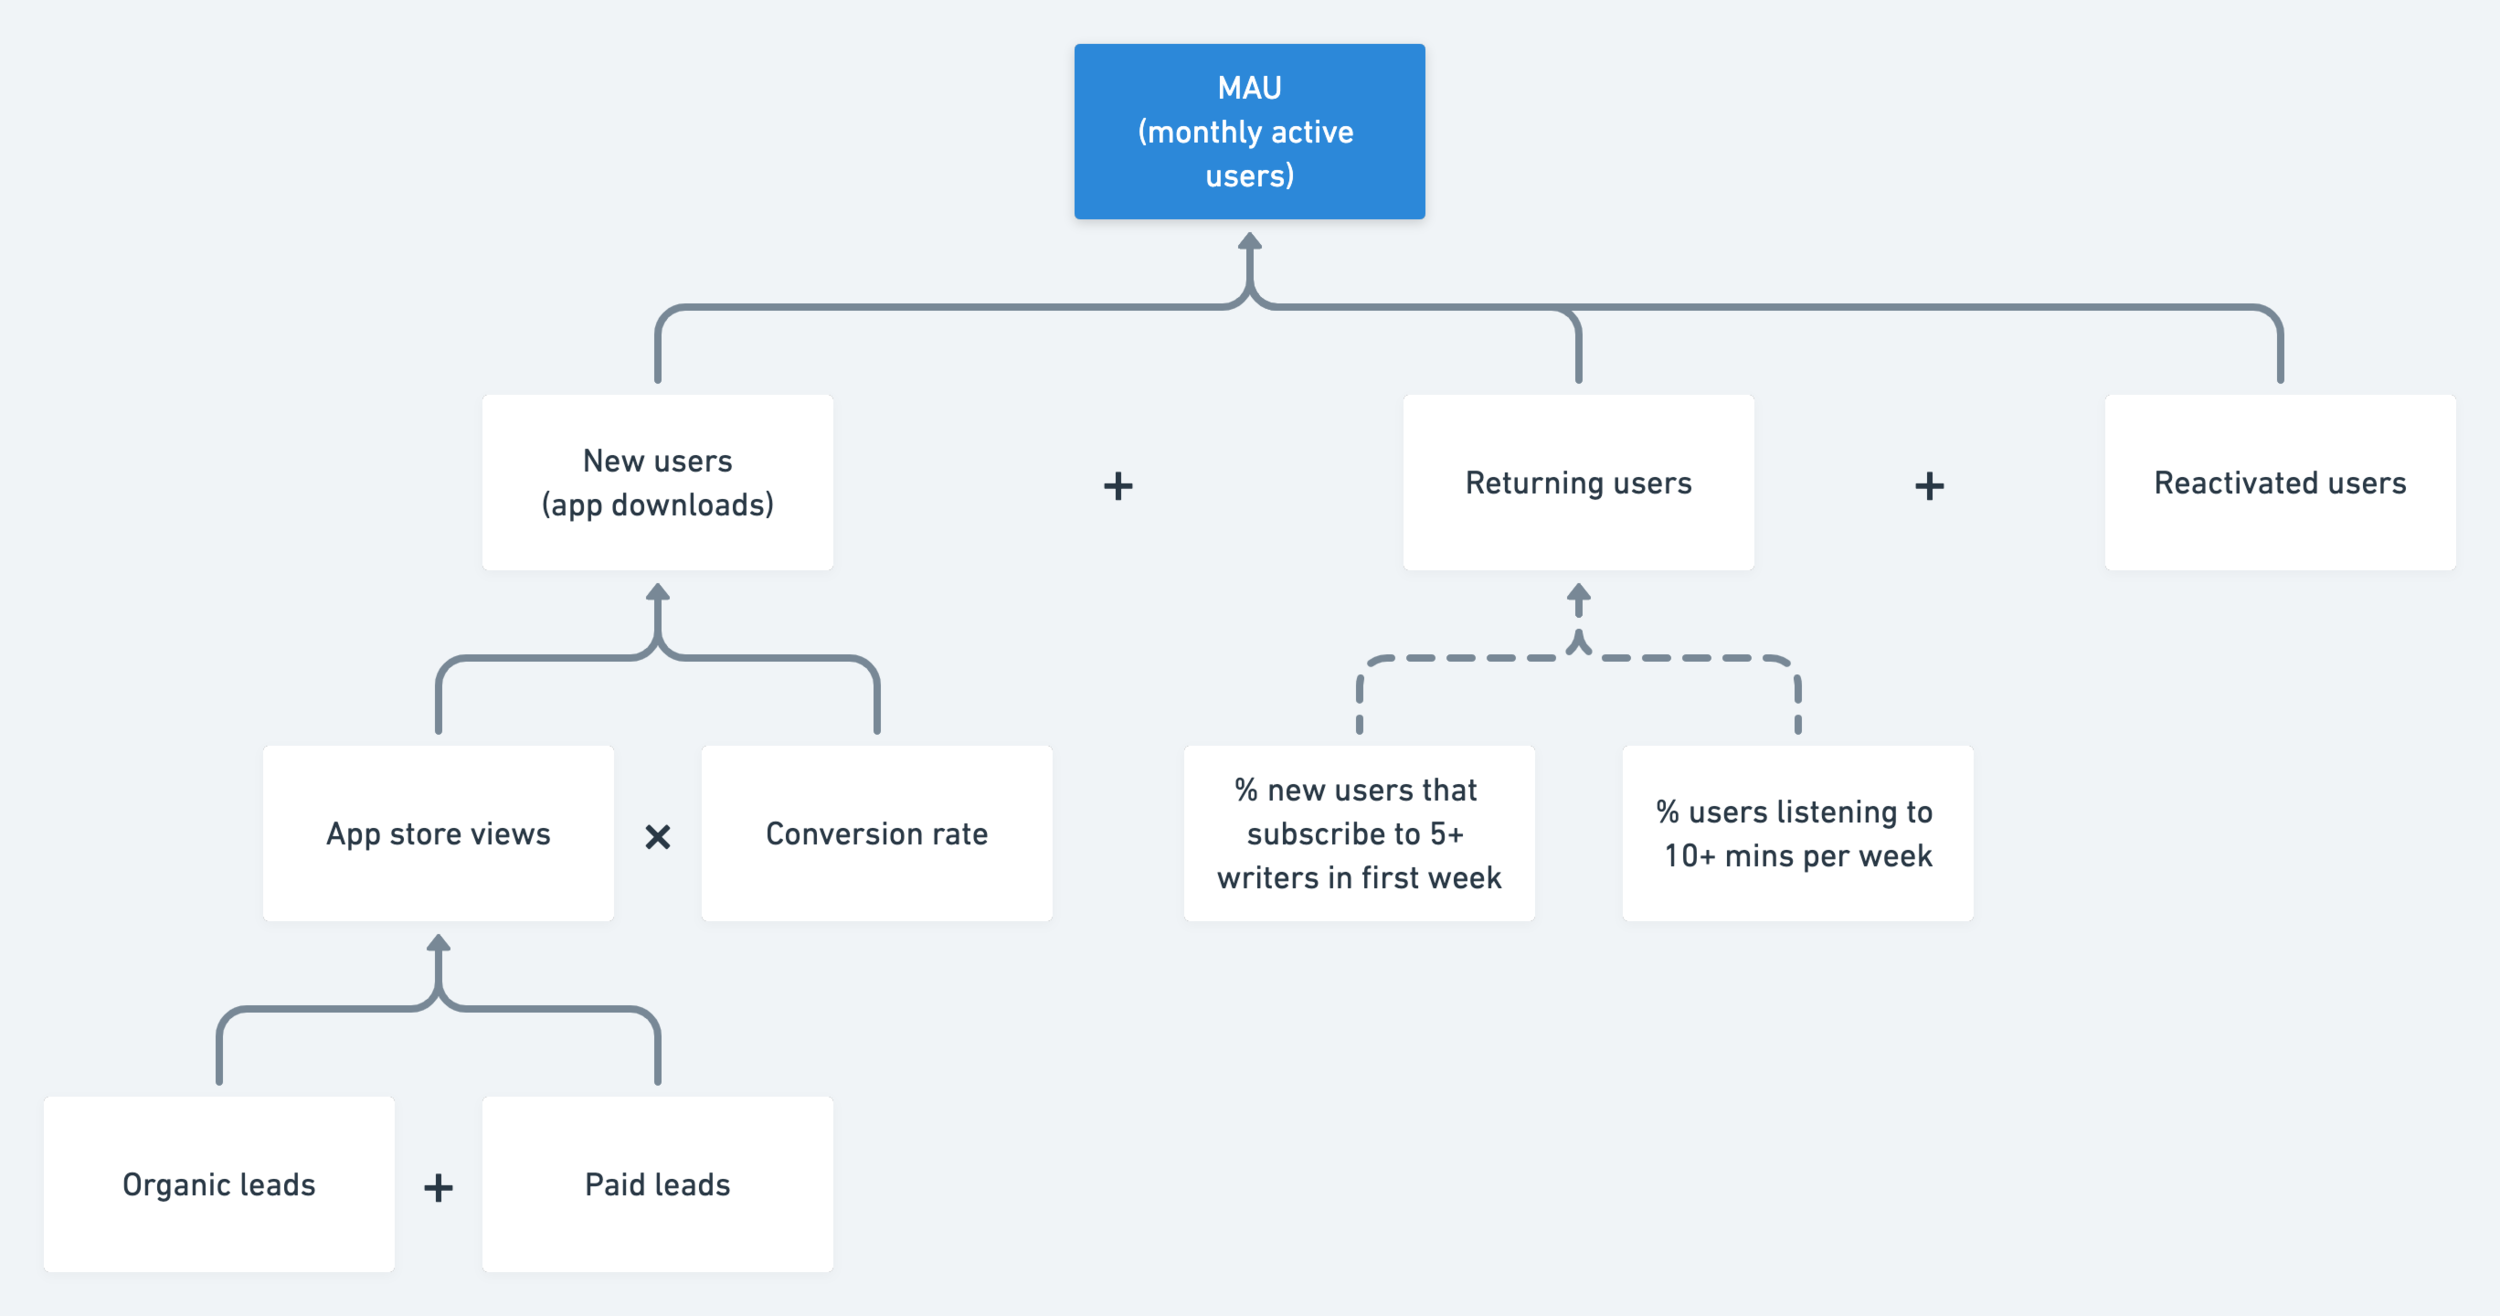
- The scenario is a news organizaiton building an app to gain younger viewers
- The plus and multiplication signs indicate the level is an equation that equals the metric above it, e.g. \(\mbox{MAU} = \mbox{new users} + \mbox{returning users} + \mbox{reactivated users}\)
- The dotted lines in the center branch indicate that these are hypotheses (i.e. they aren’t sure if they’re causal or not.)
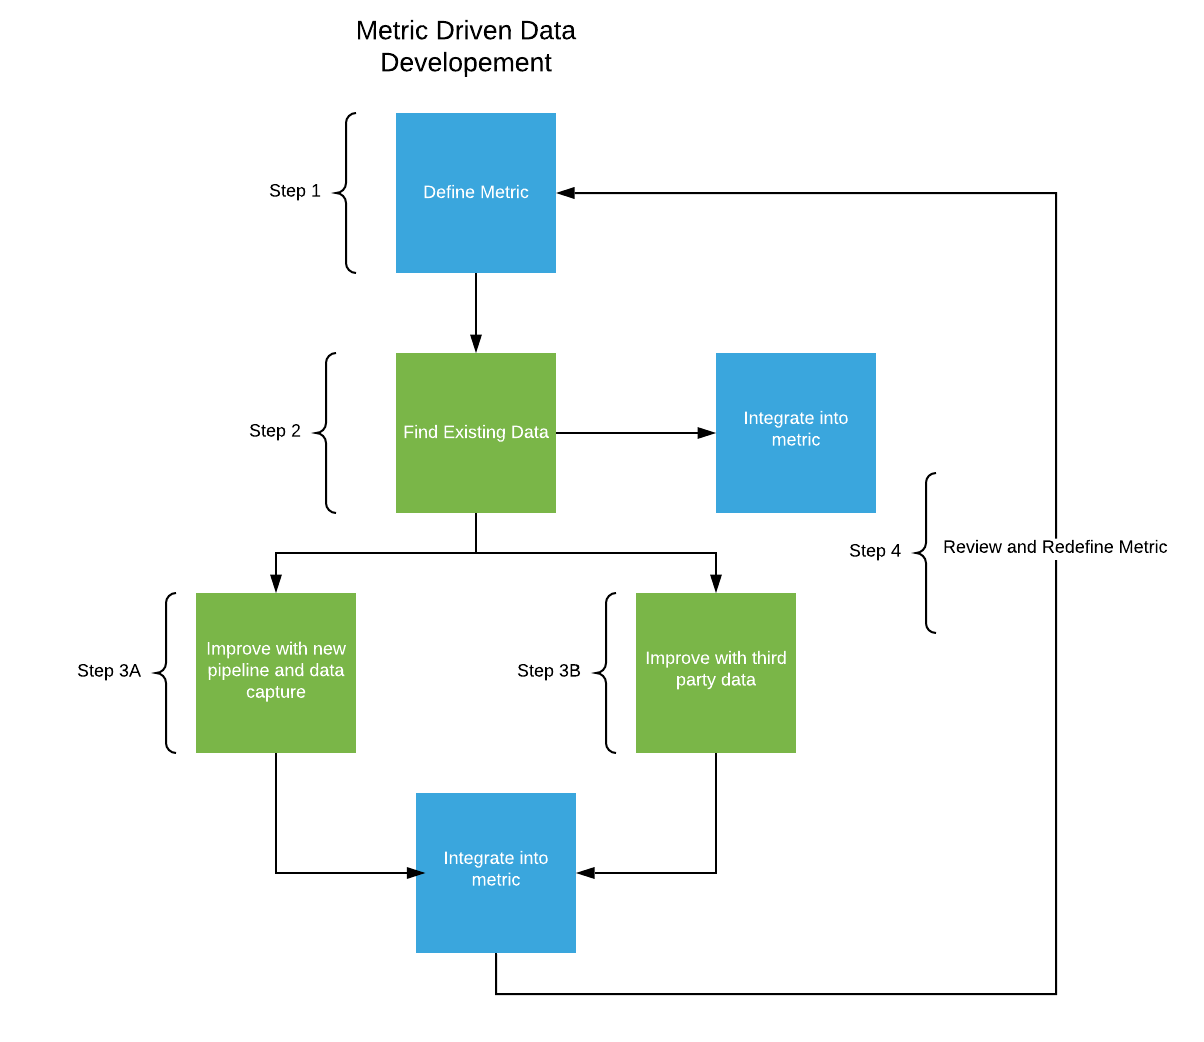
Developing a KPI Data Pipeline
- Kind of like working backwards in the data analysis workflow (design driven development)
- Quantify the problems and develop KPIs that can inform the direction of the business
- 10-15 organizational KPIs is common
- Examples: Number of daily sales, the number of new customers, decreasing cost of operations/logistics
- Build data pipelines around these critical KPIs
- What data can we use that we already have access to?
- What kind of internal data do we need to capture?
- What kind of third party/external data could be useful?
- What is the least amount of data available that can be used to approximate each KPI metric?
- After the simplest version of the metric is built, you can brainstorm on how it can be improved.
- Personalize a general metric to your specific business.
- Split a general metric into smaller metrics can increase accuracy (e.g. product line, geography, etc.)
- After the simplest version of the metric is built, you can brainstorm on how it can be improved.
- What kind of storage will we need?
- Adding a pipeline for a new data source
- Capture a sample of the data to examine its potential. (e.g. cookies on your website)
- If metric measured from new data is potentially valuable, build a simple, less robust (without sacrificing too much data integrity) pipeline to your lake.
- Meaning fewer built-in quality checks
- Doing it this way does add technical debt
- If metric feeds into a company-wide metric, then additional checks will need to be added
- E.g. no duplicate datasets, data corruption, or data losses.
- After 6 months or so, if metric remains useful, make pipeline more robust.
- Adding third party data pipeline (e.g. Equifax)
- E.g. demographic, income data
- If a product has a certain demographics associated with it, this data can be used to weight customers relative to the demographic specifics of that product.
- Get a sample first to determine if it’s worth it
- 3rd party data is expensive to buy and usually a reoccurring cost.
- Can be time-consuming and resource intensive to add the pipeline
- Get transparency on how the data was collected and validity checks used
- Periodically reevaluate whether the metrics fundamentally still make sense from a business perspective and how they can be improved.
- Expand pipelines to capture additional data in order to continue to refine metrics
- Drop and add metrics as business and trends change.
- Redefine metrics as needed
Monitoring
- Misc
- Also see Anomaly Detection
- Notes from Building a Monitoring System That Actually Works
- Monitoring raw metrics can be misleading. Consider normalization when appropriate
- See Marketing >> Search Engine Marketing >> Bid Elasticity >> Non-Normalized metrics are misleading
- Always a good idea to have higher-level daily, weekly, or monthly monitoring alongside your real-time (per min or 15 min buckets, etc.) monitoring to keep an eye on longer-term trends.
- Processes
- Have someone responsible for monitoring and responding to alerts.
- An on-call rotation where each week, one person would be in charge of reviewing all the alerts.
- See Job, Organizational and Team Development >> Developing an On-Call Environment
- Periodically perform manual checks
- Have a process where someone (like an on-call person) reviews the metrics once a day or week.
- If necessary, you could also have monitors around the office that display critical metrics, so that more eyes are watching.
- Establish feedback loops
- When reviewing alerts and looking back at incidents you might have missed, take the time to fine-tune your monitoring system’s settings.
- Keep a changelog of monitoring changes
- Provides context about what happened to your KPIs and when.
- Gives you a valuable dataset for evaluating the real impact on your monitoring system when you make changes (like figuring out what percentage of past anomalies your new setup would actually catch).
- Have someone responsible for monitoring and responding to alerts.
- Potential Issues
- Data Lags
- It usually takes some time for data to reach your data warehouse. So you need to learn how to distinguish between cases where data hasn’t arrived yet versus actual incidents affecting the customer experience.
- The most straightforward approach is to look at historical data, identify the typical lag, and filter out the last 5–10 data points.
- Different sensitivity for different segments
- Adding more segments (e.g. regions, products) means more false positive alerts that you need to deal with.
- To keep this under control, you can use different sensitivity levels for different segments (e.g. 3 standard deviations for the main KPI and 5 for segments).
- Avoid alert fatigue with smarter alerts
- Build logic to filter out redundant notifications
- Examples:
If we received the same notification within the last 3 hours, don’t fire another alert.
If there’s a notification about a drop in the main KPI plus more than 3 segments, only alert about the main KPI change.
- Data Lags