DS Use Cases (intermediate level - data needs to be centralized and not siloed)
Demand forecasting models for optimizing the stock levels.
Market basket analysis models for creating better newsletter offers.
Dynamic pricing models using competitors’ prices for better pricing strategies.
Customer segmentation model for better understanding our customers’ shopping preferences and providing them with customized offers and loyalty discounts.
Approach to deciding on a store to close
Considerations
Catchment Area: How to define the area that matters around my store
Store Network: What are the relationships between stores
Predicting Sales Transfer of your Customers (aka Customer Retention)
Overlap in catchment areas and understanding how customers behave in your store network can help in this estimation
Predicting the Impact on Acquiring New Customers (aka Customer Acquistion)
Bringing it together
Calculate 1-year, 3-year impact of removing a particular store
Rank these impacts to choose a store whose removal will have the least impact
Measurement & Model Improvement
e.g. Including real estate data such as lease terms and market intelligence on competition and anchor stores
Impact on Customer Retention
Depends on the convenience and quality of other channels for doing business (such as online or in physical locations), customer loyalty to the company and its products, and market competition.
If you have historical data on customer retention after a store closure, you can use catchment and store network features to predict what will happen with customer retention if you decide to close a particular store.
Impact on Customer Acquistion
For a particular store, take the its catchment area and remove any section that overlaps with another store’s catchment.
This area will not have any support from a brick-and-mortar perspective to help in your acquisition efforts
Look at trends over time to get a sense of the relative importance of this store’s area to the overall chain and whether you should build a digitally supported strategy to offset the loss of acquiring new customers at a fraction of your cost of operating a retail store at that location
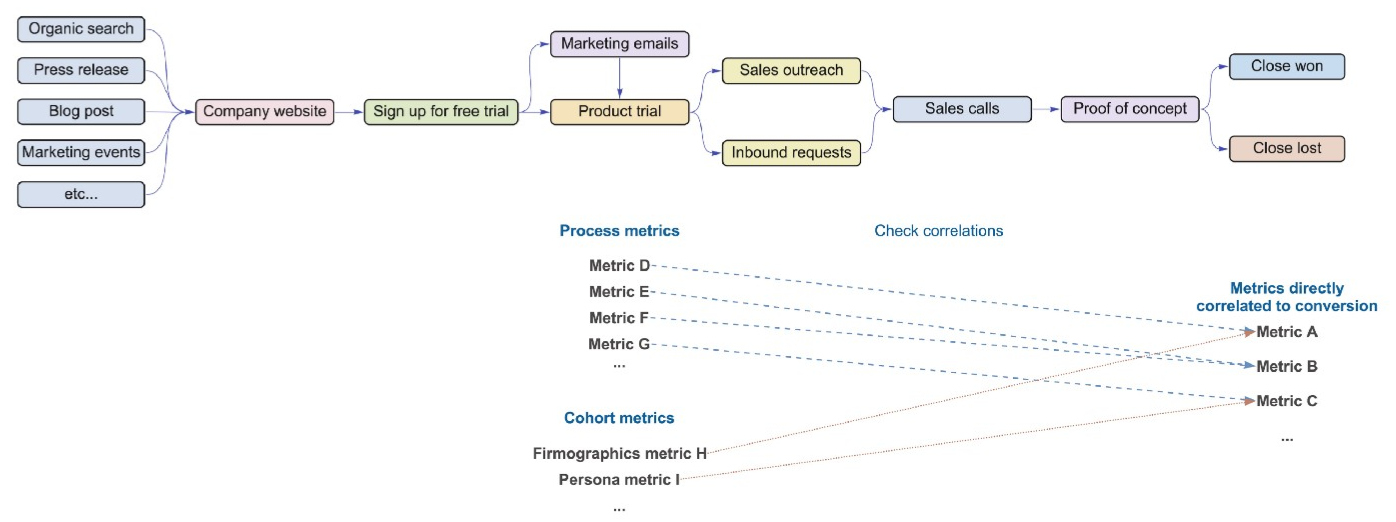
Brainstorm on metrics that may correlate with conversion and form hypotheses
e.g. Metrics that describe user behaviors in proof-of-concept
Which customer cohorts are likely to schedule sales calls with us and how do they behave without sales guidance
i.e. Which cohorts are more likely to convert if they are given a sales call
Look at how prospects behave in product trials and interact with marketing emails
EDA
Plot metrics by cohort
Calculate correlation of metrics to conversion
Cohorts can be segmented by any grouping factor
Model
If you have enough data, model conversion rate ~ predictors (beta regression?) or convert/no covert ~ predictors (logistic regression, ML, DL)
Otherwise, weight cohorts by their correlations with conversion
Catchment
Refers to the sphere of influence from which a retail location, such as a shopping center, or service, such as a hospital, is likely to draw its customers.
Major considerations – supply factors, market demand factors, drive time from customers, transportation access (e.g. interstate) and consumer interactions
Steps
Use the customers that purchased at the store in the past 12 or 24 months (you need to be the judge on timeframe based on your business model), and map them to where they live, e.g., at census block group level.
If the area is massive, applying an optimization function, where you use a polygon and work to minimize the size of the area while keeping the cumulative percent of the total sales as large as possible. (70-80% of cumulative sales is typically optimal)
Assume this optimization function takes into account the considerations mentioned above
Measuring the amount of competition in the given catchment area is useful
Catchment areas might overlap.
Store Network
Understanding how stores are connected beyond a catchment area is essential to make smarter optimization decisions (i.e. closing or opening stores).
Steps
Pick a store and for each customer, note which of your other stores (including ecommerce) that customer has shopped at
(Typically) 3 types of customers:
Customers who shop at this store exclusively
Customers who spend the majority of their $ with you at this store and spend a smaller amount at other stores, including e-commerce
Customers who spend a small amount of their $ at this store and spend the most significant amount at other stores, including e-commerce
For the ones that have shopped at multiple locations, those are generally your more loyal and high-value customers.
This data forms the basis of the network model
If the network gets too complicated, then pruning by adding addition rules might be necessary
e.g. Establishing rule for a minimum amount spent to the store network