70+ complete case studies solving a business or operational issue with analytics or automation solutions
Subjects
Supply Chain Sustainability
Data Analytics for Business Strategy
Logistics Performance Improvement
Supply Chain Optimization
Visualization & Reporting
Generative AI
Automate Tasks
Supply Chain Analytics Apps
Systems
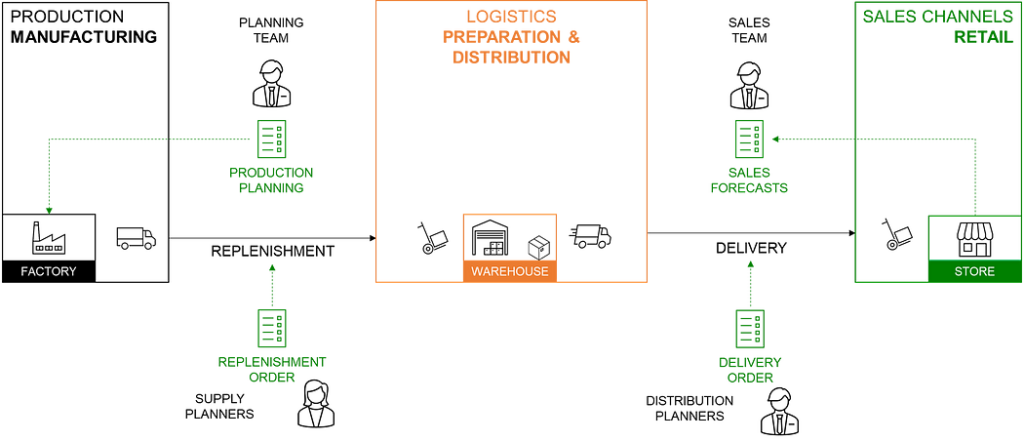
Flow Distribution of Units Between Production Areas and Markets
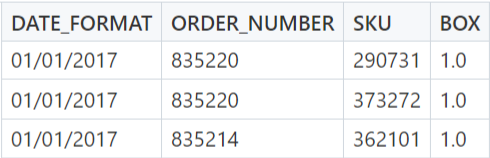
Data
Source: the production facility name (left-side)
Target: the market supplied (right-side)
Units: the number of items flowing (width of bars)
Interpretation
India is the biggest country for production output
Japan market demand is mainly supplied locally
USA and Germany do not have local production facilities
Network Optimization
X-Axis: each column represents a demand scenario (i.e. there are 50 demand scenarios in this example)
Y-Axis: are the production/supply locations
A blue box means that that location is included in the optimal configuration of locations for that scenario
e.g. In scenario 1, having a low capacity facility in India and a high capacity facility in India is optimal for this scenario.
I think this viz can be done with {waffle} using geom_wafflewithouttheme_enhance_waffle
Simulate how the variability of demand in various markets (e.g. 50 scenarios) affects the optimal distribution of production/supply locations
Hopefully a configuration of locations will be optimal for a preponderance of scenarios. Assuming each scenario is equally important, that configuration of locations is the optimal choice.
Or I guess you could weight each scenario by frequency or something. Maybe you have a distribution of scenarios from which you drawing from.